18 November, 2024
Welcome to this week’s JMP Report,
A busy week on the PNGX last week, with K9,117,033 worth of trading. In total six of the stocks on the exchange saw transaction volumes:
WEEKLY MARKET REPORT | 11 November, 2024 – 15 November, 2024
| STOCK | WEEKLY VOLUME |
CLOSING PRICE | VALUE | BID | OFFER | CHANGE | % CHANGE |
| BSP | 320,279 | 19.50 | 6,245,441 |
19.30 | – | 0.45 | 2.36% |
| KSL | 893,722 | 3.20 | 2,859,910 | 3.14 | 3.25 | 0.06 | 1.91% |
| STO | 915 | 19.60 | – | 19.60 | – | (0.05) | (0.25%) |
| NEM | 28 | 169.00 | – | 169.00 | – | 19.00 | 12.67% |
| KAM | – | 1.75 | – | 1.40 | 1.75 | – | – |
| NGP | 2,100 | 1.00 | – | – | 1.00 | – | – |
| CCP | 4,459 | 2.62 | 11,683 | 2.62 | – | – | – |
| CPL | – | 0.69 | – | – | 0.69 | – | – |
| SST | – | 50.00 | – | – | 50.00 | – | – |
| TOTAL | 9,117,033 |
0.09% |
Key takeaways:
-
BSP increased a further K0.45 to K19.50, an increase of 2.36%, on reasonable volume of 320,279 shares for a total value of BSP shares traded last week of K6,245,441.
The YTD share price increase for BSP is K5.80, having started the year at K13.70. This amounts to an increase of 42.34% this year. When we add the cumulative dividends for this calendar and financial year of K1.51 (final dividends for FY2023 of K1.06 and FY2024 interim dividends of K0.45 per share), the total YTD return for BSP shareholders is an impressive K7.31 per share or 53.36%.
With last week’s increase in the share price, BSP broke through the K9 billion in market cap level, finishing the week valued at K9.11 billion.
-
KSL, likewise, had another good week with 893,722 shares changing hands at a closing price of K3.20 for total value of K2,859,910. The KSL YTD 2024 share price has increased by K0.70 from K2.50 at the start of the year. This represents an increase YTD of 28.00%. When we add cumulative YTD dividends of K0.266, we get a total return YTD2024 of K0.966 or 38.64% – ignoring the impact of dividend withholding taxes. Also a very strong performance.
-
CCP saw modest trading volumes at K2.62. YTD 2024, CCP is up by K0.57 per share, having started 204 at K2.05. This amounts to an increase of 27.8%,
When we add the dividends YTD of K0.25 per share, the total returns to shareholders YTD 2024 is K0.82 per share or a total of 40%.
Clearly the PNGX financial services segment has performed incredibly strong so far this year.
-
A small number of STO shares changed hands at K19.60, being a drop of K0.05 from last week.
-
In addition, there were small trades in NGP and NEM. In the case of NEM, this reset the market price to K169.00, up K19.00 or 12.67%.
WEEKLY MARKET REPORT | 11 November, 2024 – 15 November, 2024
| STOCK | NUMBER ISSUED OF SHARES |
MARKET CAP |
2023 INTERIM DIV | 2023 FINAL DIV | 2024 FINAL DIV | YIELD % LTM |
| BSP | 467,219,979 | 9,110,789,591 | K0.370 | K1.060 | K0.450 | 7.74% |
| KSL | 287,949,279 | 921,437,693 | K0.100 | K0.160 | K0.106 | 8.31% |
| STO | 3,247,772,961 | 63,656,350,036 | K0.310 | K0.660 | k0.506 | 5.95% |
| NEM* | – | – | – | – | – | – |
| KAM | 50,693,986 | 88,714,476 | K0.120 | – | K0.200 | 11.43% |
| NGP | 45,890,700 | 45,890,700 | K0.030 | – | K0.040 | 4.00% |
| CCP | 307,931,332 | 806,780,090 | K0.110 | K0.130 | K0.120 | 9.54% |
| CPL | 206,277,911 | 142,331,759 | K0.050 | – | – | – |
| SST | 31,008,237 | 1,550,411,850 | K0.350 | K0.600 | K0.400 | 2.00% |
| TOTAL | 76,322,706,193 | 6.14% |
a LTM = Last Twelve Months. We have calculated yields based on most recently declared
interim and final dividends.
* NEM pays quarterly dividends. We have added last 4 payments at current FX rates.
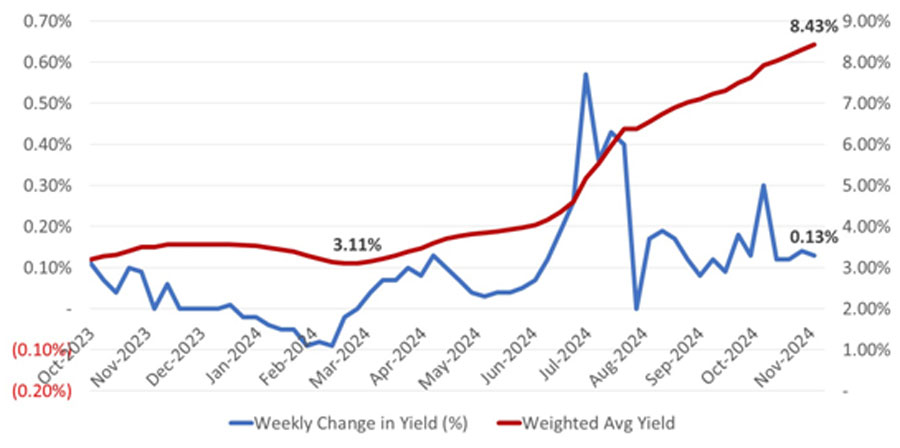
- In fixed interest markets, the 364-day yields rose another 0.13% to 8.43%, taking the increase to an aggregate of 5.32% since March 2024:
- For the firs time in more than two months, the 364-day auction was oversubscribed, with successful bids exceeding the amount offered by K4.8 million. BPNG accepted all bids received for total volumes of K322.1 million.
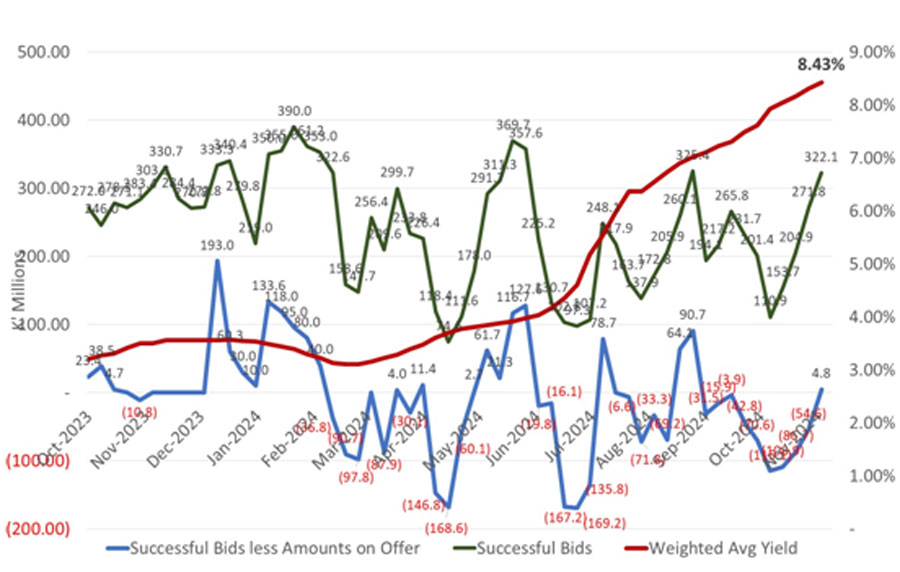
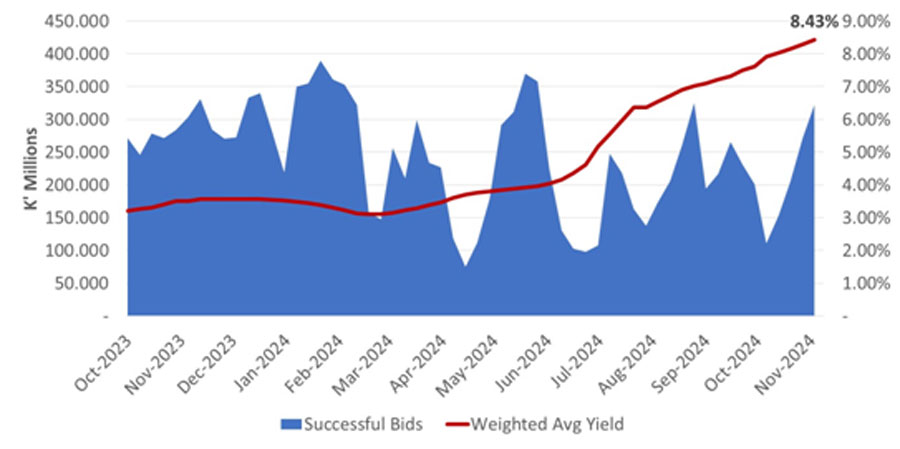
- BPNG is continuing to increase the volume of accepted bids, presumably as part of availing volumes when the market offers it. The 2025 National Budget is drawing near and it will be interesting to see what assumptions the Department of Treasury have used in relation to fixed interest market activity next year.
- Market rumours suggest significant funding may be available to GoPNG to close out the books for FY2024 from bilateral and multi-lateral partners. This may provide some reprieve to BPNG in the fixed interest markets towards the back-end of December.
- In the meantime, we expect conditions to remain difficult and for yields to keep rising at between 0.08-0.20% per week.
- It is a common parlour game in financial institutions in PNG these days to take wagers as to the FY2024 year-end 364-day Treasury Bill yields. Can BPNG keep interest rates below 9.00%?
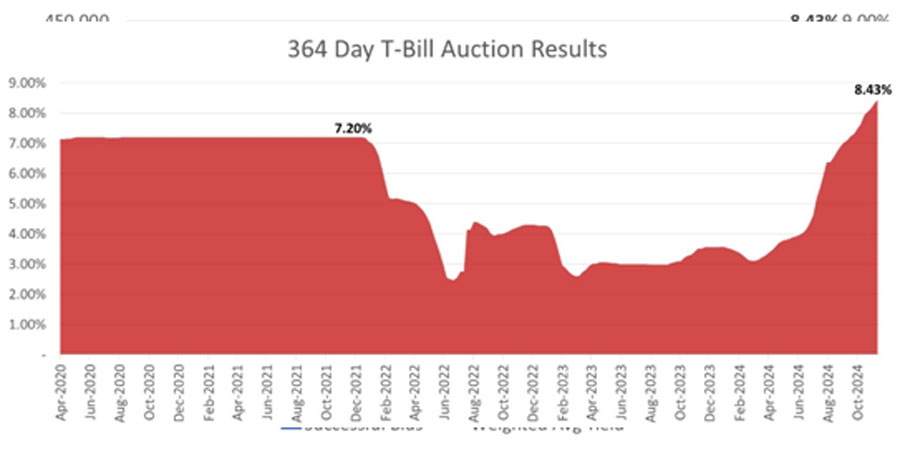
- Seen from a longer-term perspective, the recent rise in 364-day rates is more precipitous:
- In the longer-dated fixed interest market – being the Government Inscribed Stock market – we are almost reluctant to present the results of recent auctions. Volumes are modest (e.g. only K36.4 million in total sales last week) and BPNG has only been offering 5 year or longer maturities for the last couple of months.
- The result of this is that we doubt whether recent auctions have in fact resulted in efficient price discovery and when we map the last traded yield for each maturity, the lack of issuance in the shorter end of the curve results in a strange and probably inaccurate yield curve. But, in the interest of completeness, here goes:
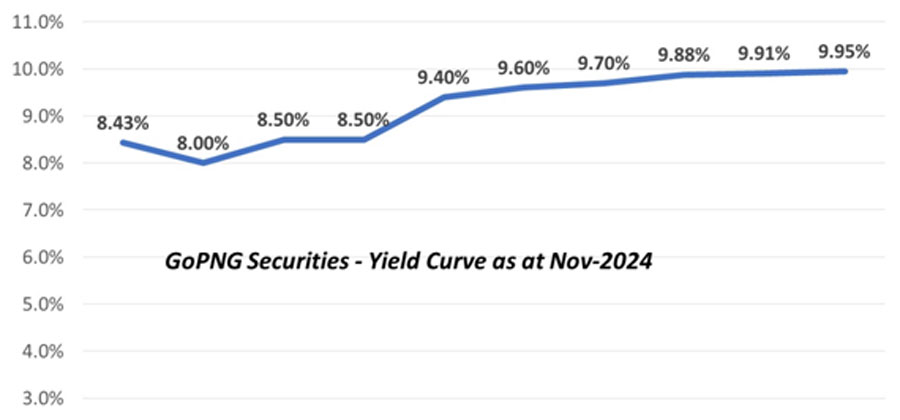
- BPNG seems adamant of keeping the yield below 10.00% and this is reflected in the volumes on offer.
What we have been reading
Investment markets and key developments

Dr Shane Oliver – Head of Investment Strategy and Economics and Chief Economist, AMP Investments | November 15, 2024
Investment markets and key developments
Global share markets were weak over the last week, not helped by the ongoing rise in bond yields and a wind back in Fed rate cut expectations after some elevated US inflation data and slightly hawkish comments from Fed chair Powell. For the week US shares fell 2.1% and have now reversed 60% of their post-election rally, Eurozone shares fell 0.2%, Japanese shares lost 2.2% and Chinese shares fell 3.3%. Australian shares also fell, albeit only by 0.1%, reflecting the weak global lead along with a further pushing out of expectations as to when the RBA will start cutting rates and a further fall in iron ore and energy prices weighing on resources shares. Apart from falls in resources companies the falls were led by consumer staple and health care stocks, more than offsetting gains in IT, utility, property and retail stocks. Bond yields rose in the US, UK, Japan and Australia but fell in Europe. Oil, metal, gold, iron ore prices and the $A all fell not helped by a further rise in the $US. The 8% pull back in gold from its October high looks like a correction after a strong run higher but is not being helped by the surge in Bitcoin, as crypto is likely taking investors away from gold, along with prospects for less Fed rate cuts.
Donald Trump’s election win and implications remains the key focus for many investors. Firstly, it’s now confirmed that the Republicans have a Red Sweep with control of the House and the Senate making it easier to pass legislation. Some budget related measures will require 60 votes in the Senate to pass but with the GOP only having 53 the process known as “budget reconciliation” will likely be used again to pass the proposed tax cuts as it only requires a simple majority providing the measures can be “shown” to be budget deficit neutral, eg that the tax cuts will drive more tax revenue as people are inspired to work harder. They may also be partly offset by tariff revenue.
Secondly, Trump’s team appointees so far are consistent with his policies and suggest implementation will proceed quickly. For example: China hawks Marco Rubio as Secretary of State and Mike Waltz as National Security Adviser signal a tough on China approach including via tariffs; Tom Holman for border control signals a border shutdown from Day 1 and a quick move to deportations (although that will face several constraints); Elon Musk and Vivek Ramaswamy to lead a Department of Government Efficiency (this sounds like a joke play on Dogecoin but is for real) to cut federal spending and bureaucracy suggesting a big cut to public servants and regulation (we had something similar in Australia with the Abbott Government’s National Commission of Audit in 2013-14 but it didn’t get too far as the government did not control the Senate); and indications are that the process to impose tariffs will start from Day 1 using executive authority with protectionists Robert Lighthizer or Peter Navaro likely to head that up. In terms of the tariffs, indications so far appear to be that they will be phased in over time allowing US businesses to decouple and adjust, which suggests something more lasting than just using them as a maximum pressure bargaining tool. What is less clear is whether the Trump Administration leans more to populism (with a focus on tariffs) or more to Reagan like supply side reforms. The appointment of Musk to rationalise bureaucracy and possibly Wall Streeters like Scott Bessent to Treasury could be a sign of the latter and would suggest a Trump Administration will be sensitive to the message from higher bond yields (ie not to add to inflation and blow out the deficit). Its still too early to tell though.
We remain of the view that Australia will see minimal direct impact from US tariffs – as only 4% of our good exports go to the US and we will likely be exempted maybe after some argy bargy because we have a trade deficit with the US. Rather the negative impact will come indirectly, via the impact on China of US tariffs (which will be partly offset by more stimulus in China) and a global trade war that Trump’s tariffs will likely trigger (with indications that China and Europe will retaliate more aggressively this time) all of which threaten weaker global growth and less demand for our exports. Trying to model this in advance is a guessing game though.
Meanwhile, the initial knee jerk market response to Trump’s victory has become a bit more nuanced over the last week – bond yields remain well up on fears his policies will drive higher inflation, higher than otherwise Fed interest rates and a higher US budget deficit; this has seen the $US surge to its highest in more than a year; Bitcoin and other crypto currencies have surged higher (notably Dogecoin which has doubled) as Bitcoin broke its downtrend since March and on expectations a Trump government would be more supportive of crypto (along with Musk’s appointment to co-run the DOGE); but shares are starting to have a tougher time with US shares reversing 60% of their post-election surge not helped by higher bond yields, a possible new inflation scare and potentially less Fed rate cuts; and non-US shares have been underperforming since the election on concerns higher US tariffs will be bad news outside the US.
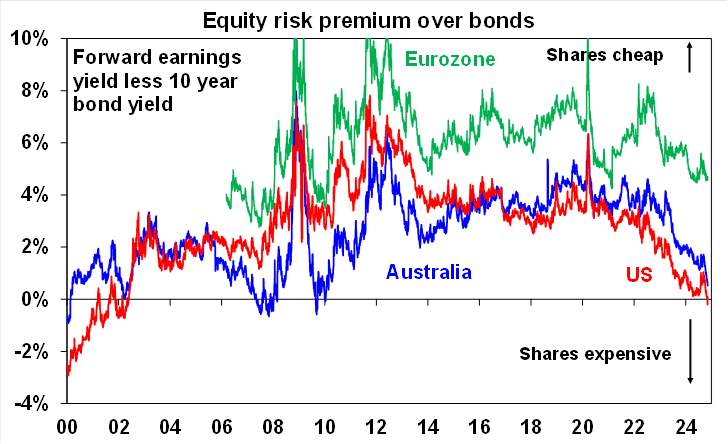
Our assessment is that the boost to US shares may have further to run in the near term but it is vulnerable to the rise in bond yields and the mix of tax cuts and deregulation (which are positive) versus tariffs (which are mostly negative) which is likely to contribute to a more volatile ride as we go through next year. Stretched valuations – with US shares now offering a negative risk premium to bonds following their recent rally and the further rise in bond yields – highlight the vulnerability of the US share market. Australian shares are also stretched on this measure, but not as much and European shares look relatively cheap. The next chart also indicates that valuations for both US and Australian shares are far less attractive now than was the case when Trump last won in 2016 when shares were actually quite cheap.
Source: Bloomberg, AMP
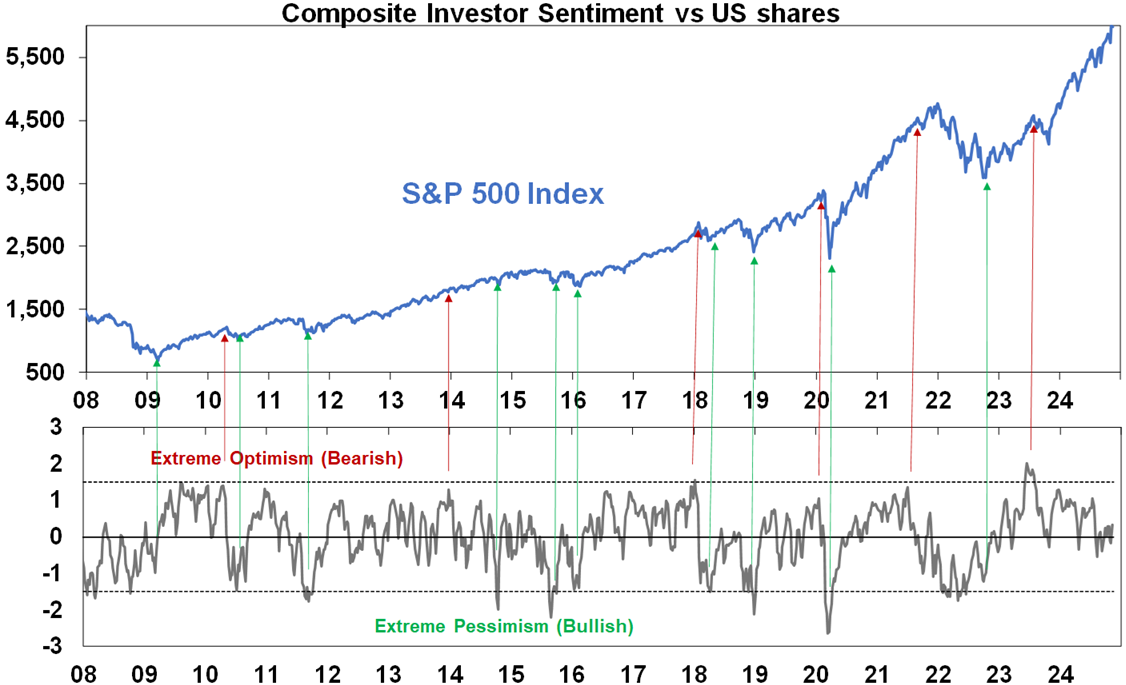
Fortunately, US investor sentiment is not at euphoric levels.
Source: Bloomberg, AMP
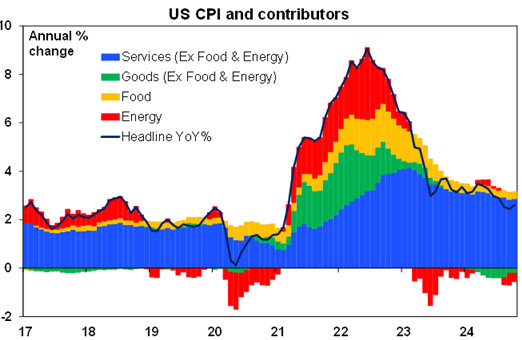
Another US inflation scare? US underlying CPI and producer price inflation were both a bit elevated in October, raising concerns that progress in getting inflation down has stalled again. Core CPI inflation was 0.28%mom leaving annual core inflation stuck around the 3.2-3.3%yoy range for five months now, with strong gains in shelter, autos and airfares and services inflation remaining sticky. And this combined with slightly higher than expected core producer price inflation suggests that core PCE inflation for October will be around 0.3%mom taking the annual rate up to 2.8%yoy.
Source: Bloomberg, AMP
A further Fed rate cut is still likely next month, but further cuts through next year are contingent on core inflation resuming its slowing trend. We think this is likely as shelter inflation looks set to slow further with softer asking rents and services inflation is likely to slow with the cooling jobs market. But Fed Chair Powell while still signalling confidence that inflation remains in a downtrend on a “bumpy path” also indicated the strong economy means the Fed does not have to hurry to cut rates and that it can be careful. Another Fed cut is still likely in December but it’s now a close call and a slower pace of easing is likely next year, particularly given that Trump’s policies regarding tariffs and more tax cuts provide some upside threats to inflation on a 1-3 year view.
In Australia, the mix of data seen over the past week is unlikely to move the RBA either way, so our view remains that the RBA won’t start cutting till February. Wages growth slowed more than expected in the September quarter, cost and price pressures slowed further in the latest NAB business survey and jobs growth slowed in October consistent with the next move in rates being down. But unemployment and underemployment remain low and consumer and business confidence rose. All of which provides no reason for the RBA to hike rates but no pressure to start cutting them either. So, a December rate cut is now extremely unlikely and we still expect the first rate cut in February by which time jobs data is likely to be weaker and December quarter inflation data is likely to have shown a further step down in underlying inflation. We concede there is a risk it could be delayed even further, with the money market now not fully pricing in a rate cut until July, but it looks like its fluctuations are partly being driven by US interest rate expectations.
In terms of the impact of Trump’s policies on the RBA it’s too early to be definitive as to what impact they will have as we don’t know the timing or quantum of the policy changes and they will work in opposite directions with US tax cuts potentially adding to US and hence global inflation (pointing to higher than otherwise RBA rates) but tariff hikes and a trade war potentially slowing global economic activity and demand for our exports (pointing to lower than otherwise RBA rates). And while the tariff hikes may impact earlier, the tax cuts may not start until 2026.
The “cost of living crisis” cost Harris and Democrats the US election. Will it cost Albanese and Labor the upcoming Australian election? The good news for Australian workers is that wages growth at 3.5%yoy in the September quarter is above inflation at 2.8%yoy resulting in real wage growth. The bad news is that it will take a long time to close the gap between the rise in prices since 2020 of 18.7% and the rise in wages of 12.9%, which has left real wages down nearly 6% over four years. This is the “cost of living crisis” in a nutshell which was the main factor behind Trump’s victory in the US and threatens Labor in Australia. Both the Biden and Albanese governments arguably paid more attention to preserving jobs than controlling inflation but far more voters are affected by inflation and the cost of living than unemployment.
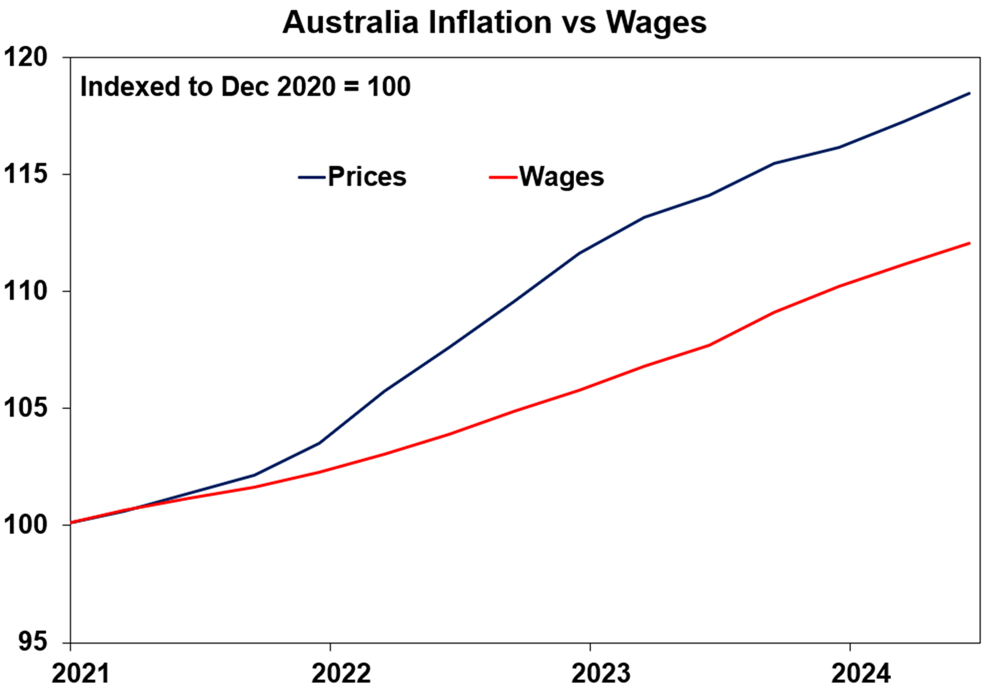
Source: Bloomberg, AMP
Major global economic events and implications
US economic data was mostly consistent with continued solid growth. Manufacturing conditions surged in the New York region in November possibly reflecting Trump optimism and pre-tariff orders, small business optimism improved slightly in October but remains subdued and jobless claims remain low suggesting the labour market is still strong even though job openings and quits have softened. Retail sales were mixed with underlying sales close to flat in October, but September sales revised up to be strong. On the weak side though, industrial production fell in October.
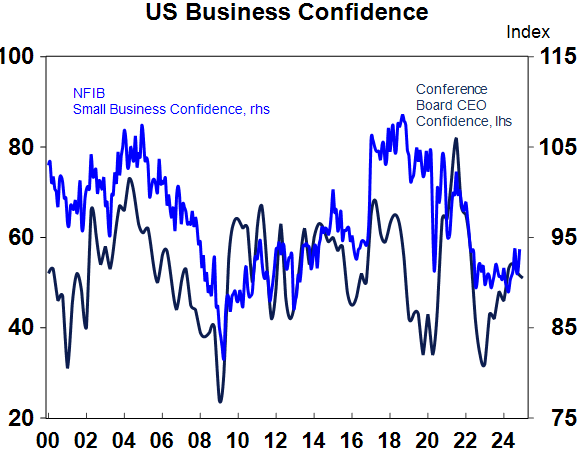
Source: Macrobond, AMP
It was a rough start but US earnings growth is coming in much better than expected. 92% of US S&P companies have reported September quarter earnings and 75.5% of results have surprised on the upside which is just below the norm of 76%. The good news though is that consensus earnings growth expectations are for 8.3%yoy, up from 4%yoy expected at the start of reporting season.
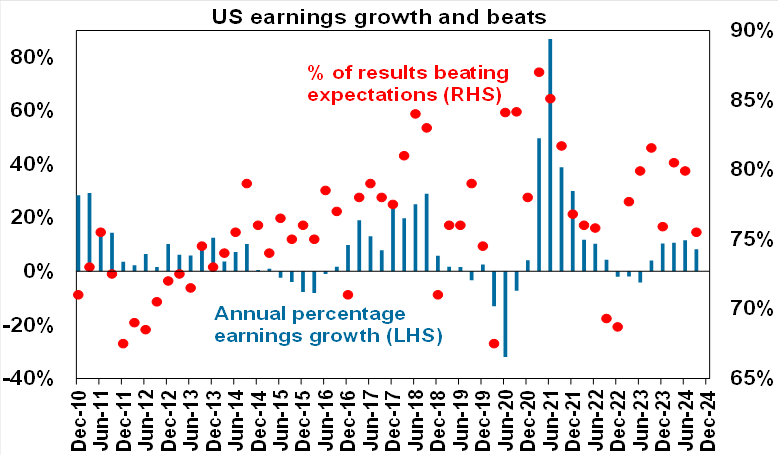
Source: Bloomberg, AMP
Japanese September quarter GDP rose just 0.2%qoq and is only up 0.3%yoy with strong consumer spending but a fall in business investment and a detraction from trade.
Chinese economic activity data for October was on balance a little bit better than expected. Stimulus measures to boost consumer spending is still required though. Growth in investment was weak and unchanged and growth in industrial production slowed slightly but growth in retail sales accelerated more than expected to 4.8%yoy. Property related data was all weak though with ongoing falls in investment, sales and home prices. Chinese credit picked up in October, but annual credit growth slowed further to 7.8%yoy from 8%yoy.
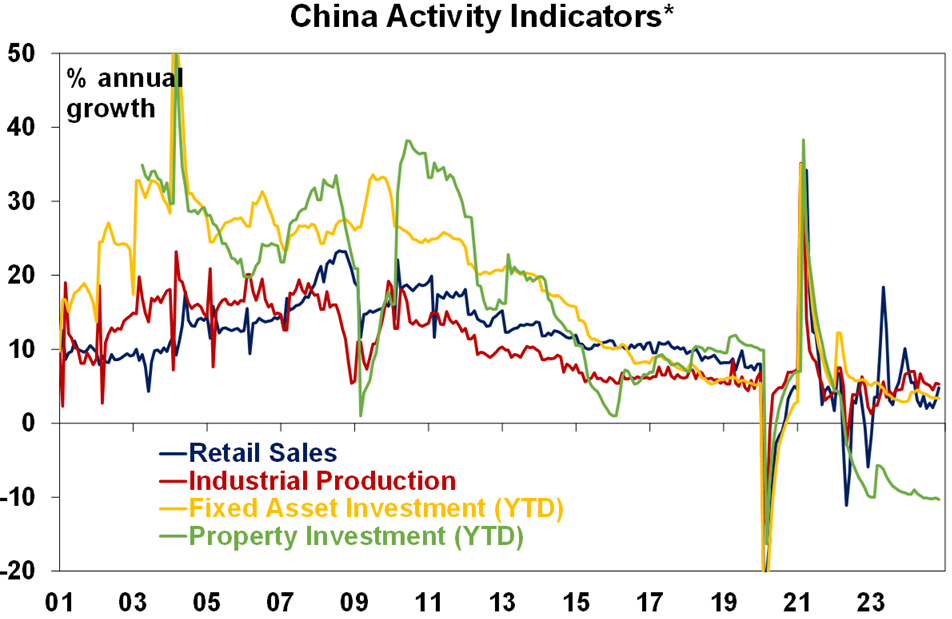
Source: Bloomberg, AMP
Australian economic events and implications
Jobs growth slowed in October, but the labour market still remains tight. Employment growth slowed to 15,900 its weakest in seven months but this could just be noise and while unemployment and underemployment are up from their lows in 2022 they remain low suggesting that the labour market remains relatively tight.
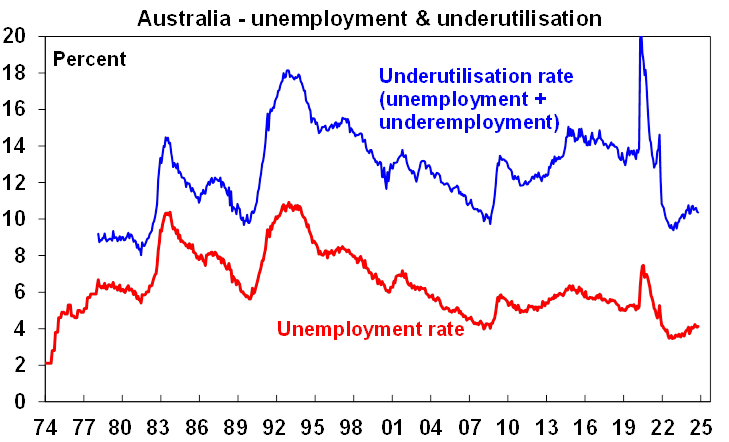
Source: ABS, AMP
However, falling job vacancies and business hiring plans evident in our Jobs Leading Indicator continue to point to slower employment growth ahead. It’s been too pessimistic over the last few years, but this possibly partly reflects businesses hoarding workers given the issues around labour shortages.
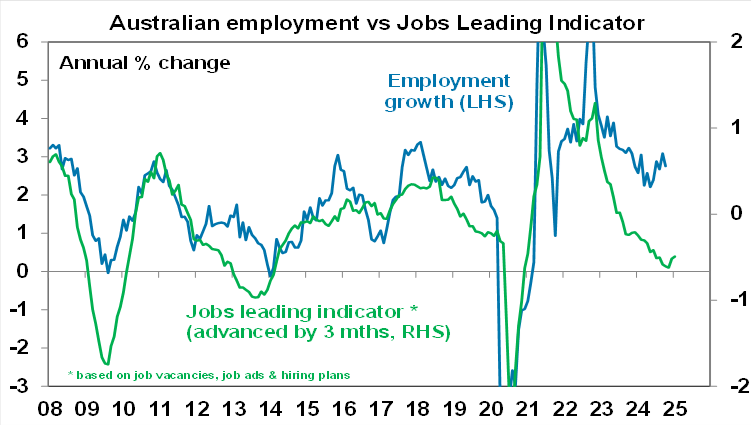
Source: ABS, AMP
Despite the still tight labour market wage growth is slowing faster than expected, likely reflecting the decline in the number of job vacancies. September quarter data showing wages growth of 0.8%qoq and 3.5%yoy adds to evidence that wages growth peaked in the December quarter last year at 4.3%yoy. Not only was this year’s rise in award wages less than last year’s increases but rates of growth in wages under individual and enterprise bargaining agreements have slowed too compared to a year ago. The share of jobs that saw a 4% or greater annual wage rise slowed from 46% in the June quarter to 31%. Apart from the smaller rise in award wages, the slowdown reflects the cooling in job vacancies and hiring plans along with the population driven rise in the supply of workers. Our Wages Growth Leading Indicator points to a further slowing in wages growth ahead reflecting falling job vacancies and hiring plans reducing worker bargaining power. Another 0.8%qoq rise this quarter will see annual wages growth slow to 3.2%yoy, which is less than the RBA is forecasting.
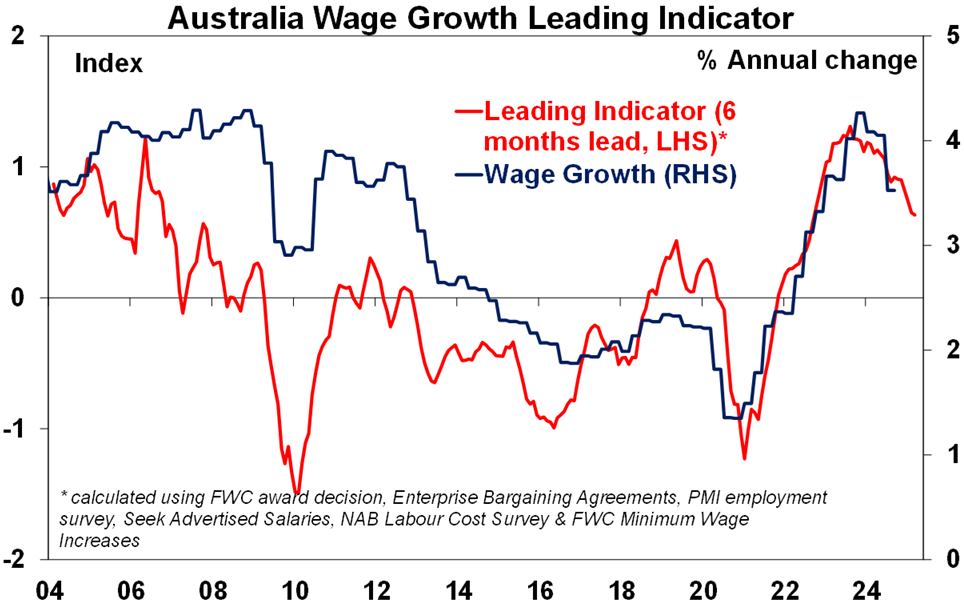 Source: Bloomberg, AMP
Consumer confidence rose another 5.3% in November. Its still soft but well up from its lows helped by expectations that rates have peaked and better growth in household disposable income.
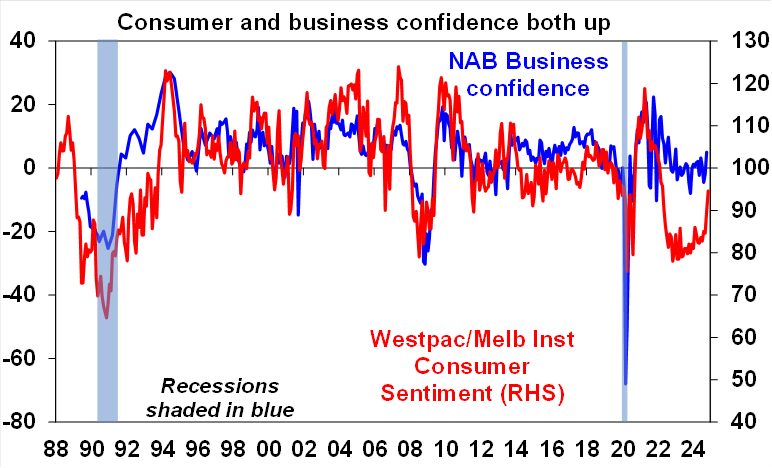
Source: Westpac/Melbourne Institute, AMP
The October NAB business survey showed unchanged business conditions but a rise in confidence. Orders remain weak and employment plans still point to weaker jobs growth.
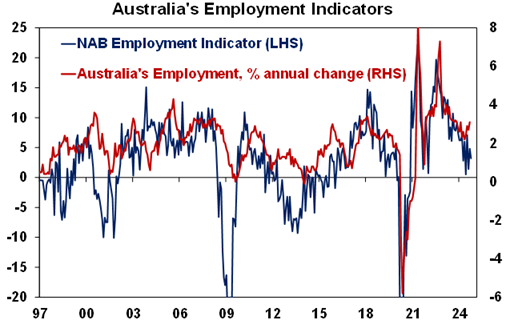
Source: ABS, NAB, AMP
The really good news though is that the NAB survey showed a further easing in cost and price pressures. Labour cost growth slowed further consistent with slowing wages growth, purchase cost growth also slowed and final product price growth slowed to back to the top end of its pre-Covid range.
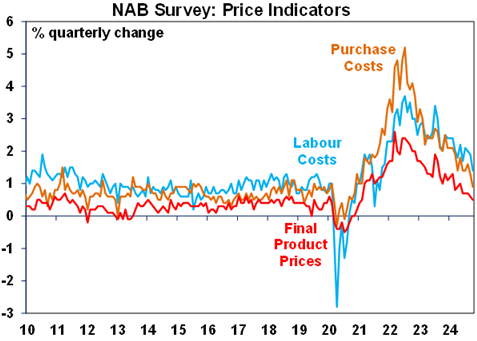 Source: NAB, AMP
What to watch over the next week?
The week ahead will see business conditions PMIs released for November on Friday. These are likely to remain at okay levels on average but with strength in the US and softness in Europe, Japan and Australia and with services strong but manufacturing weak. Key to watch will be whether the broad-based weakness in manufacturing conditions starts to flow through to services.
In other data in the US, expect home building conditions (Monday) and housing starts (Tuesday) to remain softish along with a slight fall in the Philadelphia regional manufacturing index (Thursday).
Canadian inflation for October (Tuesday) is likely to rise slightly to 1.9%yoy with underlying measures remaining around 2.4%yoy.
UK inflation for October (Wednesday) is likely to also rise slightly to 2.2%yoy with core inflation falling slightly to 3.1%yoy.
The minutes from the last RBA meeting (Tuesday) are likely to confirm a neutral bias with no inclination to move rates either way at present. A speech by Governor Bullock (Thursday) will likely reiterate the RBA’s cautious but balanced view.
Outlook for investment markets
Easing inflation pressures, central banks cutting rates, China ramping up policy stimulus and prospects for stronger growth in 2025-26 should make for reasonable investment returns over the next 6-12 months. However, with a still high risk of recession, poor valuations and significant geopolitical risks particularly around the Middle East and Trump’s policies, the next 12 months are likely to be more constrained and rougher compared to 2023-24.
Bonds are likely to provide returns around running yield as inflation slows, and central banks cut rates. They could face more losses in the near term though given uncertainty around Trump’s policies.
Unlisted commercial property returns are likely to start to improve next year as office prices have already had sharp falls in response to the lagged impact of high bond yields and working from home.
Australian home prices are likely to see some further slowing over the next few months as the supply shortfall remains, but still high interest rates constrain demand and unemployment rises. Lower interest rates should help the market next year though and we see average property prices rising by around 5% in 2025.
Cash and bank deposits are expected to provide returns of over 4%, reflecting the rise in cash rates.
A rising trend in the $A is likely taking it to $US0.70 over the next 12 months, due to a fall in the overvalued $US and a narrowing in the interest rate differential between the Fed and the RBA. A recession and US tariffs under Trump are the main downside risks.
Crypto Market Tops $3 Trillion Amid ‘Trump Bump’, Bitcoin Hits All-Time High at $93K

By Jennifer L | Posted 15/11/2024
The global cryptocurrency market has surpassed $3 trillion, fueled by renewed investor optimism following Donald Trump’s re-election as U.S. President. Alongside this, Bitcoin has reached an all-time high at $93,434.
According to CoinMarketCap, the total market cap currently sits at $3 trillion, up 4% in the past day. CoinGecko reports an even higher figure of $3.15 trillion, tracking over 15,000 cryptocurrencies, compared to CoinMarketCap’s 10,000.
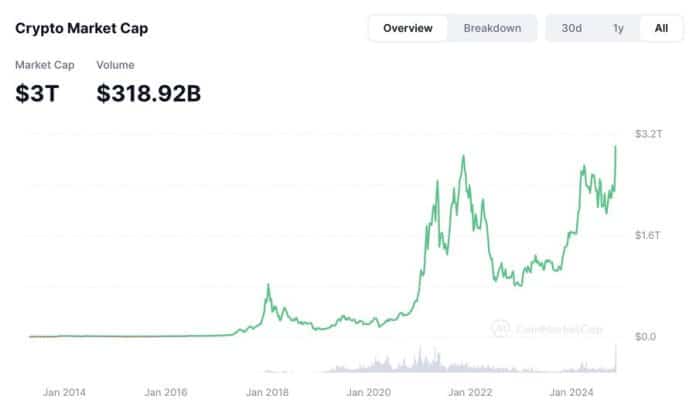
Chart from CoinMarketCap
The $3T Surge: What’s Driving the Crypto Boom?
This milestone marks an all-time high, surpassing the 2021 bull run. The surge, dubbed the ‘Trump Bump,’ reflects expectations of a pro-crypto regulatory environment under the new administration.
Trump’s campaign promises, including making the U.S. a global crypto hub and establishing a national Bitcoin reserve, have strengthened market confidence.
Institutional appetite for digital assets continues to grow. A recent survey of 400 global institutional investors revealed that 57% plan to increase their crypto allocations, with many aiming to do so within the next 6 months.
Companies like MicroStrategy have also made significant investments, recently acquiring $2 billion in Bitcoin.
Analysts predict further growth but caution against potential corrections, citing external risks like weak U.S. economic data.
Bitcoin’s Record-Breaking Rally: Is $100K Next?
Bitcoin has been a key driver of this crypto rally, hitting a new all-time high (ATH) of $93,434 on November 13. Its market cap now stands at almost $1.8 trillion, comprising 60% of the total crypto market.
Altcoins are also experiencing significant gains, contributing to the broader market’s upward momentum.
Maksym Sakharov, CEO of DeFi platform WeFi, attributes the surge to “Bitcoin’s price rally above $93,000, growing demand, and regulatory clarity.” Bitcoin has more than doubled in 2024, fueled by the launch of spot Bitcoin ETFs and increased institutional interest.
Many crypto analysts suggest Bitcoin’s rally is far from over. Some predict it could hit $100,000 in the coming months.
Galaxy Digital CEO Mike Novogratz offers an even bolder outlook, forecasting a potential surge to $500,000—if Bitcoin gains traction as a national reserve asset in the U.S.
Bitcoin Surpasses Silver, Becomes World’s 8th Largest Asset
Even more remarkable, Bitcoin has reached a new milestone. It surpassed silver with a market cap of $1.8 trillion, positioning itself as the world’s 8th largest asset. This marks a significant leap in Bitcoin’s trajectory, as it now trails only major players like gold, Apple, and Microsoft, according to Companies Market Cap.
Bitcoin market cap surpassing silver
The surge comes as Bitcoin’s price hit over $93,000, with even more bullish projections ahead. In contrast, silver fell by 2%, helping Bitcoin secure its spot ahead of the precious metal.
Institutional Momentum Drives Bitcoin’s Rise
Institutional activity played a crucial role in today’s rally. BlackRock’s iShares Bitcoin Trust (IBIT) recorded $4.5 billion in trading volume, reflecting the growing interest in Bitcoin from major financial players.
Bloomberg’s Eric Balchunas highlighted this trend, noting that Bitcoin ETFs and related assets, including MicroStrategy and Coinbase, reached a combined trading volume of $38 billion.
Optimism in the crypto market has surged following Donald Trump’s re-election, with analysts suggesting his pro-crypto stance could pave the way for favorable regulations. This sentiment has fueled predictions that Bitcoin could surpass the $100,000 mark by the end of 2024.
However, behind all this hype with the crypto industry, particularly Bitcoin’s sudden surge, lurks the digital asset’s environmental impact.
Crypto’s Environmental Toll: Balancing Growth and Sustainability
The rising energy consumption of crypto mining has sparked global concern due to its environmental impact. The White House’s 2022 report highlighted the substantial electricity demands of cryptocurrency mining, which now rival the energy consumption of countries like Poland.
In an analysis by the International Monetary Fund (IMF), crypto mining and data centers made up 2% of global electricity demand in 2022. This figure could rise to 3.5% within three years, matching Japan’s current electricity usage—the fifth highest in the world—according to projections from the International Energy Agency.
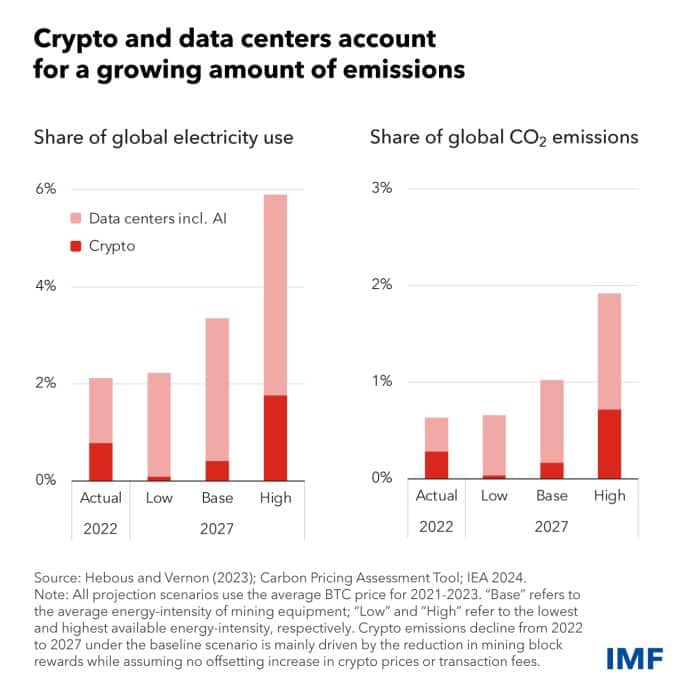
- Bitcoin’s proof-of-work (PoW) consensus mechanism is a primary contributor, with global electricity use for PoW estimated between 97 and 323 terawatt-hours annually. This translates to significant greenhouse gas emissions, with Bitcoin alone responsible for around 88 million metric tons of CO₂ each year.
The U.S. accounts for nearly 46% of Bitcoin mining emissions, releasing about 15.1 million metric tons of CO₂ annually. Other major contributors include China and Kazakhstan, emphasizing the global nature of the issue.
The mining process also has indirect environmental impacts, such as electronic waste and water usage, with one Bitcoin transaction consuming thousands of gallons of water.
Efforts to reduce Bitcoin’s carbon footprint include transitioning to less energy-intensive consensus mechanisms like proof-of-stake (PoS) and adopting renewable energy sources for mining.
However, regional emission reduction efforts often fall short due to the global supply chain’s carbon intensity. For instance, even countries with cleaner energy grids, like Norway, face indirect emissions from imported mining equipment manufactured in coal-reliant regions like China.
Interestingly, recent studies challenge the perception of Bitcoin mining’s environmental impact.
Bitcoin Mining’s Role in Carbon Reduction
Research from the Bitcoin Policy Institute (BPI) highlights how mining increasingly relies on renewable energy, turning surplus energy into a valuable resource. By using excess power from renewable sources like wind and solar, mining helps stabilize grids and reduce energy waste, proving that it can contribute to carbon reduction rather than exacerbating emissions.
The researchers also compared the energy use of Bitcoin mining, data centers, and AI server energy in the U.S. in 2023. Bitcoin used 48 TWh in 2023, while AI servers consumed between 20 and 125 TWh. On the other hand, data centers have the biggest power consumption, ranging from 100 to 325 TWh.
The following chart shows the historical results and forecasts up to 2027.
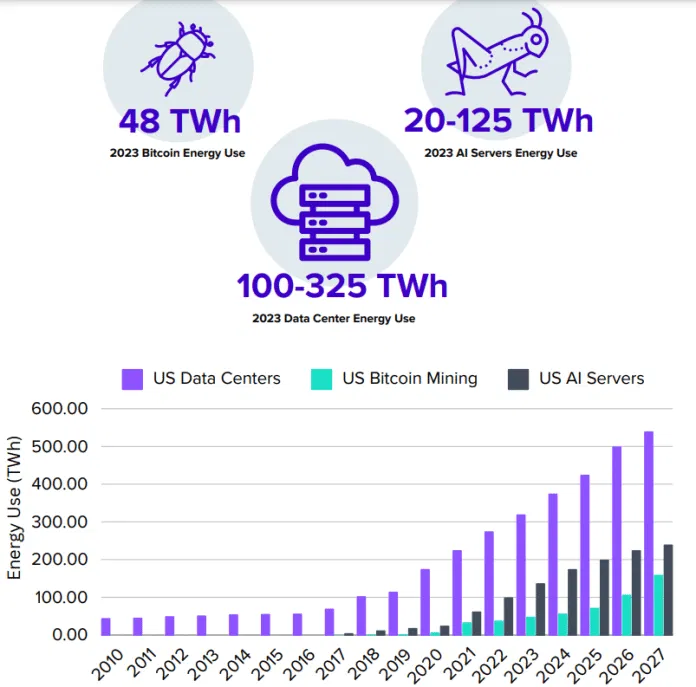
Chart from BPI
Another report from the Digital Assets Research Institute (DA-RI) reveals flaws in past research on Bitcoin’s energy use. It critiques outdated models that overlooked miners’ shift to renewable energy, resulting in sensational headlines and misinformed policies.
The new findings urge regulators to base decisions on empirical data, underscoring Bitcoin’s potential to align with global carbon reduction goals.
These studies suggest that sustainable Bitcoin mining could play a crucial role in green initiatives. By leveraging clean energy, mining could evolve into a climate-friendly industry, offering both economic and environmental benefits. As this perspective gains traction, policymakers may adopt more balanced regulations, supporting sustainable growth in the crypto sector.
The crypto market’s unprecedented growth comes with both promise and challenges. As Bitcoin leads the charge, its environmental impact sparks global debate. Sustainable mining practices and pro-crypto policies could shape a greener, more resilient future for digital assets.
Regards,
JMP Securities Team
JMP Securities
a. Level 3, ADF Haus, Musgrave St., Port Moresby NCD Papua New Guinea
p. PO Box 2064, Port Moresby NCD Papua New Guinea
Email: lars.mortensen@jmpmarkets.com
Ph: +675 7200 2233
Mobile: +675 7056 5124
Email: nathan.chang@jmpmarkets.com
Ph: +675 7167 3223
Mobile: +61 422 113 630