28 November, 2024
Welcome to this week’s JMP Report,
Total market turnover on the PNGX last week was K1,303,204, with trades in BSP, KSL and CCP recorded:
WEEKLY MARKET REPORT | 18 November, 2024 – 22 November, 2024
| STOCK | WEEKLY VOLUME |
CLOSING PRICE | VALUE | BID | OFFER | CHANGE | % CHANGE |
| BSP | 22,500 | 19.65 | 442,125 |
19.65 | 20.00 | 0.15 | 0.77% |
| KSL | 260,590 | 3.25 | 846,918 | 3.14 | 3.25 | 0.05 | 1.56% |
| STO | – | 19.60 | – | 19.65 | – | – | – |
| NEM | – | 169.00 | – | 147.00 | – | – | – |
| KAM | – | 1.75 | – | 1.40 | 1.75 | – | – |
| NGP | – | 1.00 | – | – | 1.00 | – | – |
| CCP | 5,405 | 2.62 | 14,161 | 2.62 | – | – | – |
| CPL | – | 0.69 | – | – | 0.69 | – | – |
| SST | – | 50.00 | – | – | 50.00 | – | – |
| TOTAL | 1,303,204 |
0.11% |
Key takeaways:
-
Another week – another record close for BSP – with the stock ending the week on K19.65, up K0.15 or 0.77%. The increase happened off the back of modest volumes of 22,500 shares, however significant buy order volumes are now in the system at the last traded price.
The YTD share price increase for BSP is K5.95, having started the year at K13.70. This amounts to an increase of 43.4% this year. When we add the cumulative dividends for this calendar and financial year of K1.51 (final dividends for FY2023 of K1.06 and FY2024 interim dividends of K0.45 per share), the total YTD return for BSP shareholders is an impressive K7.46 per share or 54.45%.
-
KSL traded 260,590 shares, ending the week on K3.25 – an increase of K0.05 or 1.56%.
The KSL YTD 2024 share price has increased by K0.75 from K2.50 at the start of the year. This represents an increase YTD of 30.0%. When we add cumulative YTD dividends of K0.266, we get a total return YTD2024 of K1.0166 or 40.6% – ignoring the impact of dividend withholding taxes. Also a very strong performance.
-
CCP saw modest trading volumes at K2.62. YTD 2024, CCP is up by K0.57 per share, having started 204 at K2.05. This amounts to an increase of 27.8%,
When we add the dividends YTD of K0.25 per share, the total returns to shareholders YTD 2024 is K0.82 per share or a total of 40%.
Clearly the PNGX financial services segment has performed incredibly strong so far this year.
WEEKLY MARKET REPORT | 18 November, 2024 – 22 November, 2024
| STOCK | NUMBER ISSUED OF SHARES |
MARKET CAP |
2023 INTERIM DIV | 2023 FINAL DIV | 2024 FINAL DIV | YIELD % LTM |
| BSP | 467,219,979 | 9,180,872,587 | K0.370 | K1.060 | K0.450 | 7.68% |
| KSL | 287,949,279 | 935,835,157 | K0.100 | K0.160 | K0.106 | 8.18% |
| STO | 3,247,772,961 | 63,656,350,036 | K0.310 | K0.660 | k0.506 | 5.95% |
| NEM* | – | – | – | – | – | – |
| KAM | 50,693,986 | 88,714,476 | K0.120 | – | K0.200 | 11.43% |
| NGP | 45,890,700 | 45,890,700 | K0.030 | – | K0.040 | 4.00% |
| CCP | 307,931,332 | 806,780,090 | K0.110 | K0.130 | K0.120 | 9.54% |
| CPL | 206,277,911 | 142,331,759 | K0.050 | – | – | – |
| SST | 31,008,237 | 1,550,411,850 | K0.350 | K0.600 | K0.400 | 2.00% |
| TOTAL | 76,407,186,654 | 6.14% |
a LTM = Last Twelve Months. We have calculated yields based on most recently declared
interim and final dividends.
* NEM pays quarterly dividends. We have added last 4 payments at current FX rates.
- In fixed interest markets, the 364-day yields rose another 0.14% to 8.57%, taking the increase to an aggregate of 5.46% since March 2024:
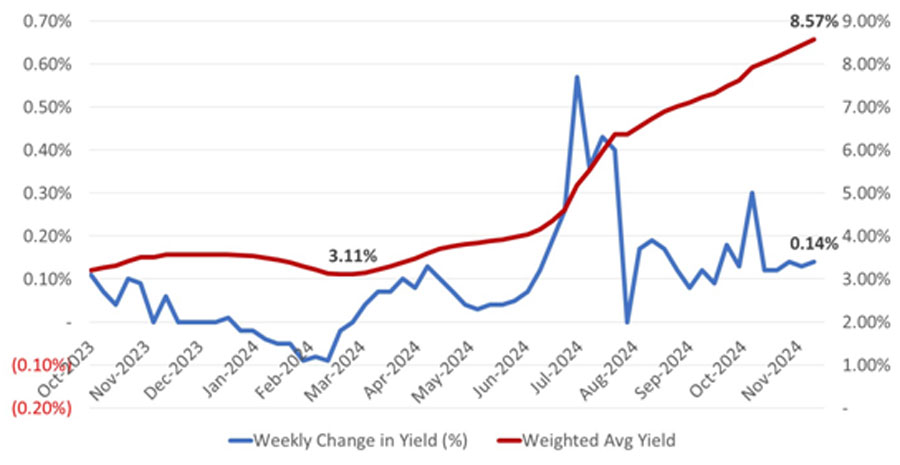
- It is interesting to note that in March 2024 (most recent data available from BPNG), the total value of issued and outstanding Treasury Bills was K14.37 billion. On the assumption that the bulk of this is represented by 364-day bills, GoPNG’s annual interest bill for Treasury Bills has increased by at least K780 million based on the increases in market interest rates alone.
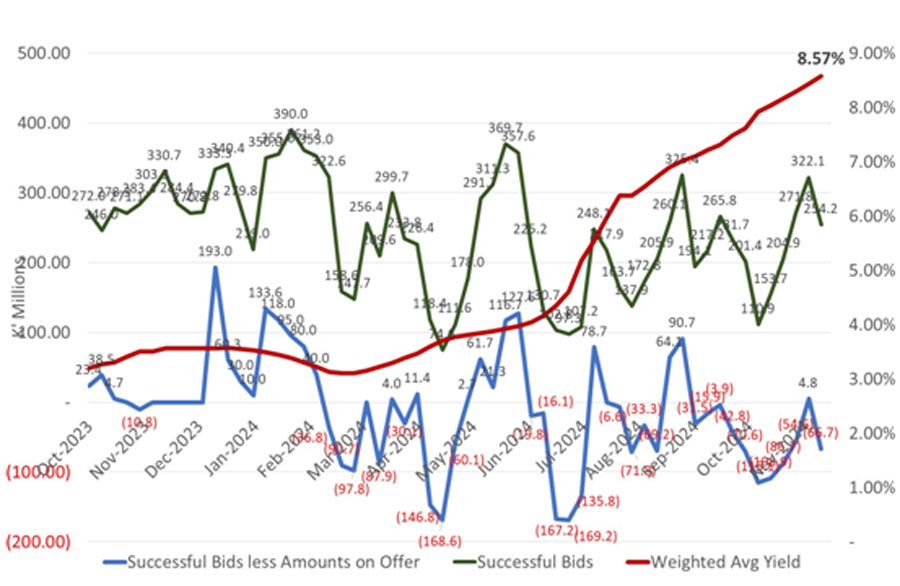
- Treasury Bills were back to being undersubscribed, with the amounts offered exceeding successful bids by K66.7 million. BPNG accepted total volumes of K254.2 million.
-
Market rumours continue to suggest significant funding may be available to GoPNG to close out the books for FY2024 from bilateral and multi-lateral partners. This may provide some reprieve to BPNG in the fixed interest markets towards the back-end of December.
-
We hope and expect some clarity to be provided in the 2025 National Budget as to the issuance program and broader debt management strategy of GoPNG during FY2025.
-
In the meantime, we expect conditions to remain difficult and for yields to keep rising at between 0.08-0.20% per week.
-
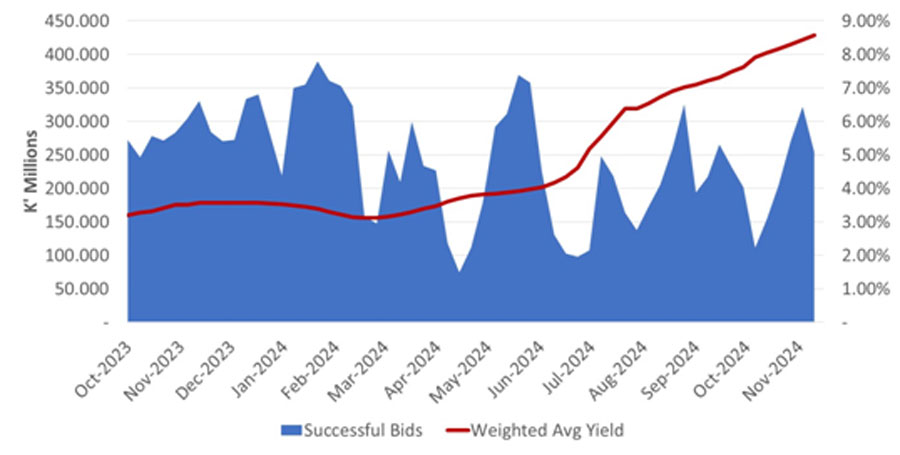
At the same time, Treasury Bill rates continue their inexorable rise towards 9%:
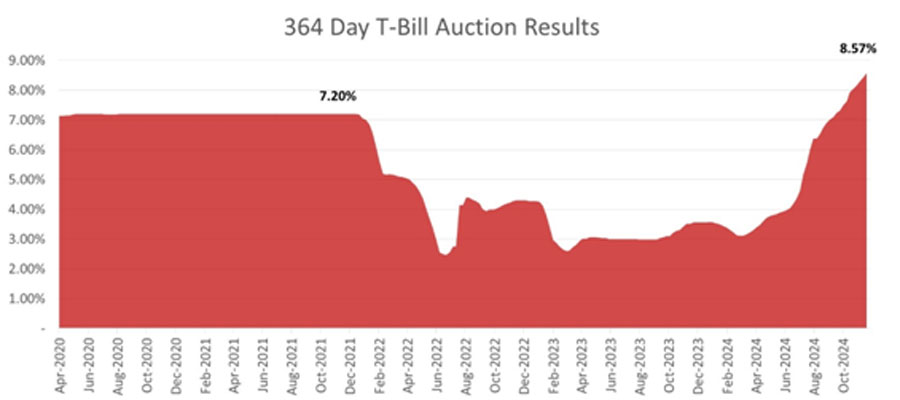
- Seen from a longer-term perspective, the recent rise in 364-day rates is more precipitous:
What we have been reading
Have We Entered a Commodity Super Cycle?

Ainslie Bullion | November 28, 2024
Commodity super cycles are defined by consistent price rises for more than five years – and will quite often last decades. They occur due to the time lag between physical supply catching up to price signals.
While commodity prices rise due to demand being greater than supply, producers won’t have an immediate reaction to rising prices, as they are unsure about whether the price increases will be sustained. This leads to the supply-demand gap widening, further increasing prices. Eventually, prices reach a point where producers are comfortable investing into infrastructure that boots supply, however, there is a further time lag due to licencing, construction and production timelines – before additional supply can enter the market to meet demand, this often takes years – while prices continue to increase in the meantime, due to organic demand as well as speculation entering the commodity markets.
Once the additional supply capacity enters the market, the gap starts to reduce and the increased capacity for production will often mark the bull phase of the super cycle concluding.
There have been regular commodity super cycles through history, with the most recent one starting in 1996 and peaking in 2011 – driven primarily by the industrialisation of emerging economies like Brazil, Russia, China and India – with China being a major contributor.
Most economist agree that the next commodity super cycle has begun and is expected to affect commodities across the board, from metals, to oil and gas, to food and coffee – while being led by commodities in the green energy space (with a focus on battery materials).
While over 80% of global battery production is controlled by China, leading lithium producers like Australia and Chile are positioned to benefit from the current cycle, as well as Russia being a top producer of nickel.
Key factors driving the current cycle
A rise in global population – currently above 8 billion.
Emerging market economies – are expected to be a major driver of this cycle, similar to the previous one, however this time lead by India rather than China.
What is unique to this cycle is the focus on the transition to alternate energy sources across the G-20 nations, expected to create a sustained surge in demand for raw materials such as lithium, hydrogen, copper, nickel, uranium and silver.
A set-in, secular macro trend of deglobalisation is expected to further drive the commodity super cycle, with nations bunkering down on essential supplies rather than relying on international trade agreements, which might not remain in the upcoming decades, due to the uncertainty created by conflicting geopolitical aims between major superpowers.
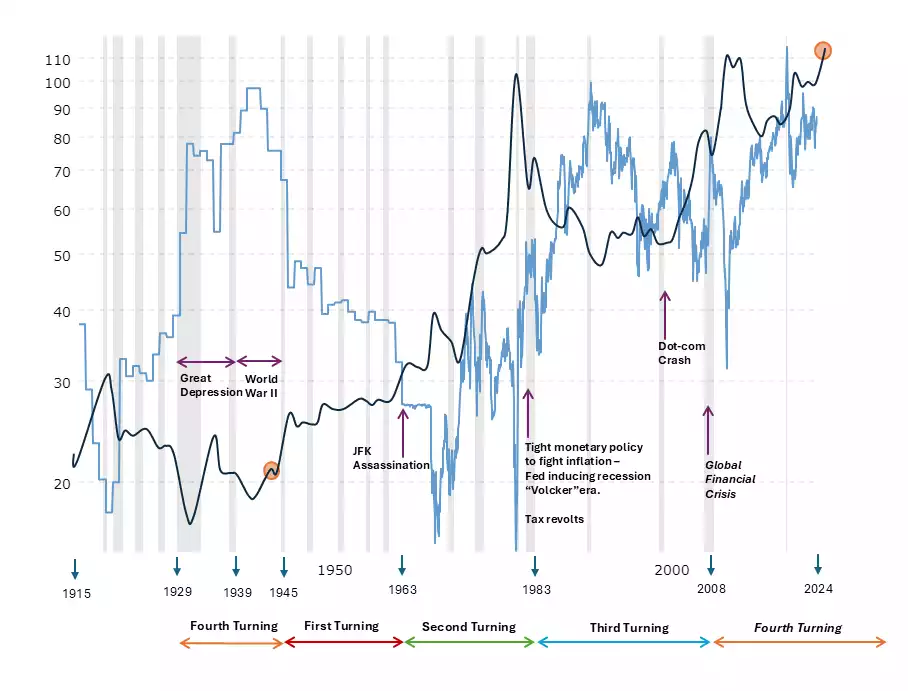
This ties in almost perfectly from a timing perspective, with the 80-year socio-economic cycle called the fourth turning. As we move from the fourth turning of one cycle to the first turning of the next, we can expect major global conflict and a rise in nationalism with a sharp decline in globalisation.
In the previous fourth turning ending, post WWII, we saw the gold-to-silver ratio drop from around 90 to below 20 – and silver enter a multi decade bull cycle. Are we currently on the verge of something similar? Most indicators point to it being a significant probability.
Fourth Turning Cycles
The gold to silver ratio (light blue) could be expected to fall off, at a scale – seen once in a century – as we move from the current fourth turning, into the first turning of the next cycle.
Inflation
The most definitive indicator of a commodity supercycle is rising prices.
Since 2022, the global central banks have been fighting inflation that has reached levels unseen for 40 years.
A rate hiking cycle and quantitative tightening measures have led to inflation returning to the 2% region, while also avoiding a recession.
However, while inflation has stopped rising, it hasn’t gone away. After compounding for many years, consumer prices remain high, and a majority of commodities have seen record breaking prices – breaking out of multi decade price ranges and setting new all-time highs.
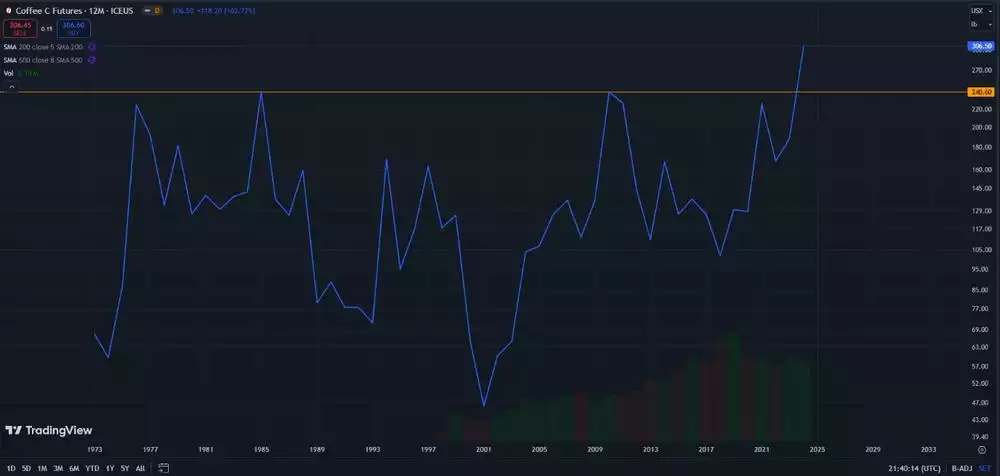
Coffee Futures 12 Month Chart
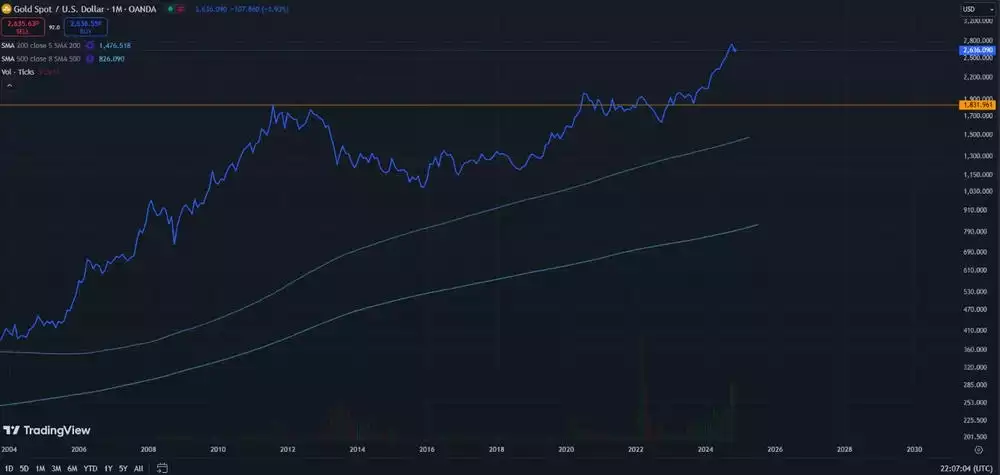
Gold Spot Price 1 Month Chart November 2024
These price rises are in the face of the headwinds of a high US dollar, high bond yields and high interest rates- however with all 3 expected to fall off – commodities are likely to soar to incredible heights – as these factors become tail winds – causing inflation to return in a significant way.
With a rate cutting cycle in progress across global central banks, and an expected flood of liquidity into the global financial system in the mid-term – the macro trend of bond yields dropping is expected to continue.
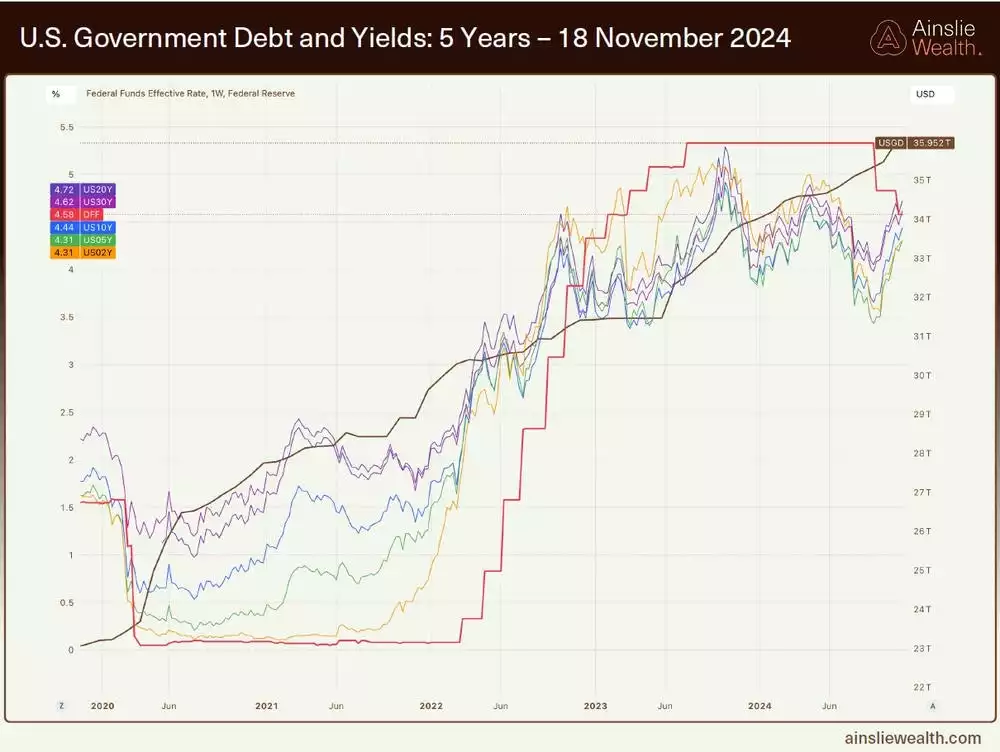
US Government Debt and Yields 5 Years 18 November 2024
Bond yields dropping causes a bull market in bonds collateral values, which improves the lending capacity of private banks, further contributing to the expected flood of liquidity into the financial system, and a falling US dollar. This would result in most assets rising together, specifically those priced in US dollars like global commodities.
In the long term however, this creates a generational crisis of inflation, leading to another round of rate hikes, and monetary tightening.
How resilient is the banking sector to another round of rate hikes (which would reduce government bond collateral values, the primary collateral held by private banks) – how resilient is the land market between homeowners and commercial property investors, to a round of rate hikes?
Would the seemingly inevitable commodity boom likely coincide with a land recession and systemic financial crisis?
This ties in well with the 18.6-year land cycle – where most western economies have recorded a land recession every 18.6 years on average, over the last 350 years of recorded data. The current recession is expected between 2025 and 2028.
While precious metals rise in an environment of increasing liquidity, they continue to rise in the recovery phase of a systemic collapse, being decentralised and acting as a store of value and safe haven asset class. This positions precious metals, as the place to be during a commodity super cycle.
Silver
Supply of silver has been in a deficit for 5 years, by roughly 1 billion ounces.
Outside of its monetary purposes, it is used for industrial applications in electronics, automotive, military and medicine, while also being a key ingredient for solar panels (with green energy set to be a predominant driver of the ongoing commodity super cycle)
2023 reported a 184.3-million-ounce deficit of physical silver. The 2024 deficit is projected to be around 215.3 million ounces, the second largest in more than 20 years.
Solar and electronics markets are noted as the key drivers, for supply being unable to keep up with demand.
Silver and gold are up over 35% this year despite the headwinds of high bond yields and a strong US dollar.
As the US Fed continues cutting interest rates, the dollar will weaken, and the entire commodities complex will strengthen. With gold and silver expected to take centre stage, all eyes are on silver with the GSR currently around 85, expected to fall off at a scale unseen for 100 years, as we move from one 80-year cycle to another.
US stock market surges to record high despite Trump’s tariff threats

Thanks to AlJazeera | Posted 27/11/2024
US stocks have hit record highs despite United States President-elect Donald Trump’s pledge to impose sweeping tariffs that threaten to upend international trade.
The S&P 500, which measures the performance of 500 of the biggest US firms, rose 0.57 percent on Tuesday to top its previous high set on November 11.
The tech-heavy Nasdaq Composite climbed even higher, gaining 0.63 percent.
The Dow Jones Industrial Average, which tracks 30 large companies including Microsoft, McDonald’s and Goldman Sachs, rose 0.3 percent.
Some big-name individual stocks fell, including General Motors and Ford Motor, both of which import vehicles from Mexico, a target of Trump’s tariff threats.
Advertisement
Trump’s announcement on Monday that he would impose a 25 percent tariff on all goods from Mexico and Canada and an “additional” 10 percent tariff on Chinese products rattled international markets, dragging down Asian and European equities.
Stock exchanges in Tokyo, Shanghai, Sydney, London, Paris and Frankfurt all closed lower on Tuesday, while currencies including the Canadian dollar, Mexican peso, Chinese yuan and the euro fell against the US dollar.
While Trump has repeatedly flagged his intention to impose sweeping tariffs on imports to the US, investors are weighing whether the Republican intends to follow through on his threats or is seeking a bargaining chip in negotiations with other countries.
Economists have warned that Trump’s proposals for broad-based tariffs would raise the cost of everyday items in the US and drag down global growth.
Trump’s supporters argue that tariffs will bring back manufacturing jobs from overseas as well as give Washington a stronger hand to negotiate more favourable trade deals with other countries.
Regards,
JMP Securities Team
JMP Securities
a. Level 3, ADF Haus, Musgrave St., Port Moresby NCD Papua New Guinea
p. PO Box 2064, Port Moresby NCD Papua New Guinea
Email: lars.mortensen@jmpmarkets.com
Ph: +675 7200 2233
Mobile: +675 7056 5124
Email: nathan.chang@jmpmarkets.com
Ph: +675 7167 3223
Mobile: +61 422 113 630