16 December, 2024
Welcome to this week’s JMP Report,
A modest week leading into the Holiday Season on the PNGX last week, with K2,232,276 worth of shares changing hands in the open market:
WEEKLY MARKET REPORT | 9 December, 2024 – 13 December, 2024
| STOCK | WEEKLY VOLUME |
CLOSING PRICE | VALUE | BID | OFFER | CHANGE | % CHANGE |
| BSP | 86,730 | 19.90 | 1,725,927 |
19.70 | – | 0.23 | 1.17% |
| KSL | 153,905 | 3.25 | 500,191 | 3.05 | – | 0.05 | 1.56% |
| STO | 314 | 19.61 | 6,158 | 19.61 | – | – | – |
| NEM | – | 150.00 | – | 150.00 | – | – | – |
| KAM | – | 1.75 | – | – | 1.75 | – | – |
| NGP | – | 1.00 | – | – | 1.00 | – | – |
| CCP | – | 2.70 | – | 2.70 | – | – | – |
| CPL | – | 0.69 | – | – | 0.70 | – | – |
| SST | – | 48.00 | – | – | 50.00 | – | – |
| TOTAL | 2,232,276 |
0.16% |
Key takeaways:
- Another record close for BSP – this time at K19.90 or within a whisker of K20.00 per share. Reasonable volumes in the market of 86,730 shares trading at a total consideration of K1,725,927. The stock was up K0.23 or 1.17% for the week.
- YTD total shareholder returns for BSP shareholders amounts to K7.71 (K6.20 share price increase and K1.51 in cumulative dividends received per share) or 56.3% during FY2024. A very strong result. BSP enters 2025 with strong tailwinds but a big challenge to repeat this year’s performance.
- KSL traded back up at K3.25 – an increase down K0.05 or 1.56%. Total return YTD amounts to K1.016 per share (K0.75 share price increase and K0.266 in cumulative dividends). This equates to a YTD return of 40.64% to shareholders.
- A small parcel of STO shares also changed hands at an unchanged closing price of K19.61 per share.
- BSP’s total market capitalisation is now K9.297 billion – up from K6.401 billion at the start of FY2024.
WEEKLY YIELD CHART | 9 December, 2024 – 13 December, 2024
| STOCK | NUMBER ISSUED OF SHARES |
MARKET CAP |
2023 INTERIM DIV | 2023 FINAL DIV | 2024 FINAL DIV | YIELD % LTM |
| BSP | 467,219,979 | 9,297,677,582 | K0.370 | K1.060 | K0.450 | 7.59% |
| KSL | 287,949,279 | 935,835,157 | K0.100 | K0.160 | K0.106 | 8.18% |
| STO | 3,247,772,961 | 63,688,827,765 | K0.310 | K0.660 | k0.506 | 5.95% |
| NEM* | – | – | – | – | – | – |
| KAM | 50,693,986 | 88,714,476 | K0.120 | – | K0.200 | 11.43% |
| NGP | 45,890,700 | 45,890,700 | K0.030 | – | K0.040 | 4.00% |
| CCP | 307,931,332 | 831,414,596 | K0.110 | K0.130 | K0.120 | 9.26% |
| CPL | 206,277,911 | 142,331,759 | K0.050 | – | – | – |
| SST | 31,008,237 | 1,488,395,376 | K0.350 | K0.600 | K0.400 | 2.08% |
| TOTAL | 76,519,087,411 | 6.13% |
a LTM = Last Twelve Months. We have calculated yields based on most recently declared
interim and final dividends.
* NEM pays quarterly dividends. We have added last 4 payments at current FX rates.
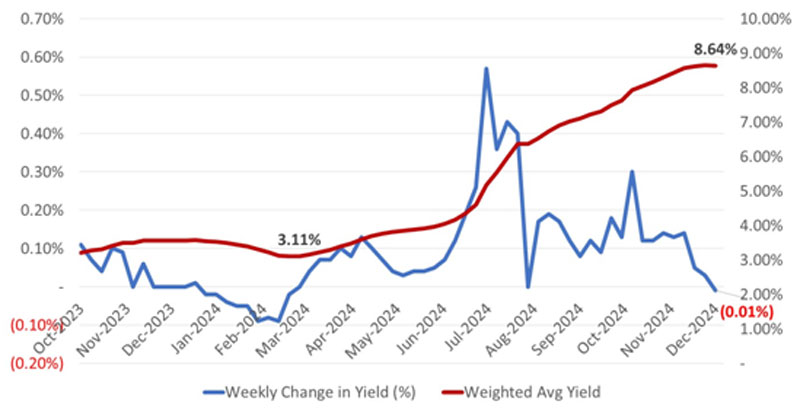
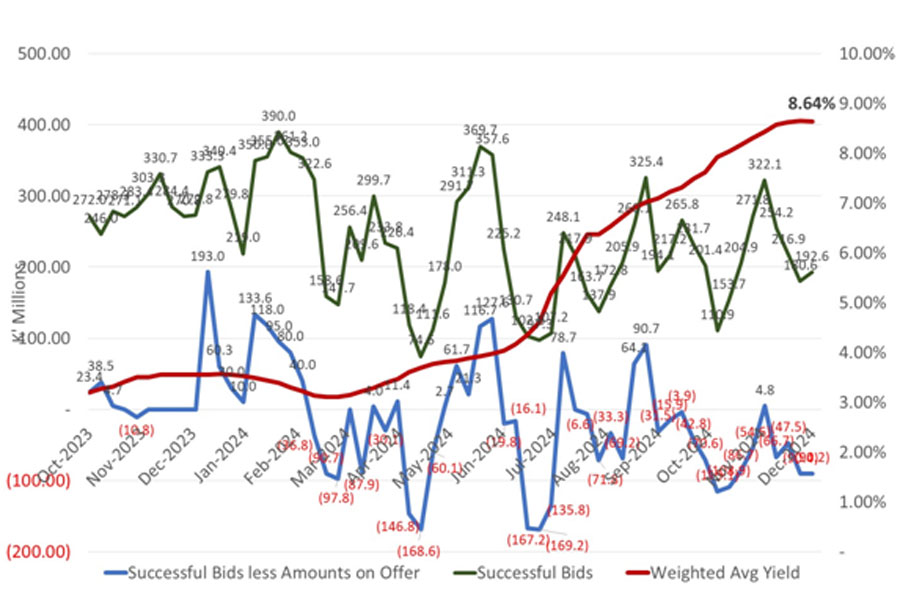
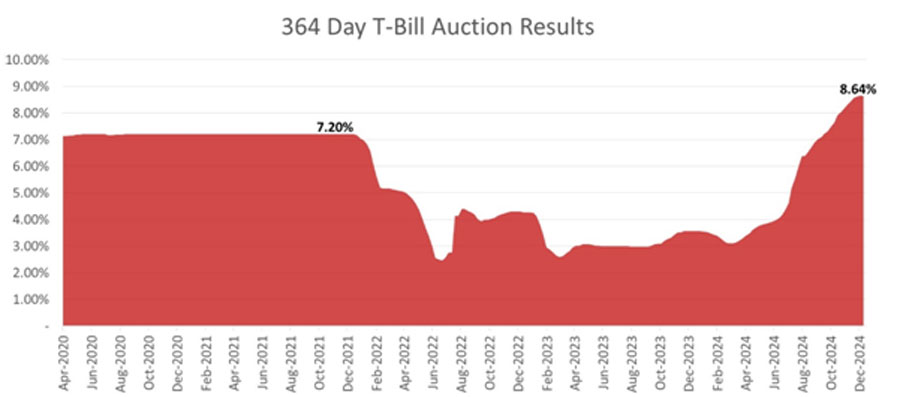
- In fixed interest markets we experienced the first drop in yields in the 364-day auctions since March 2024 – albeit by a paltry 1 basis point.
- As we predicted in recent months, the end of the financial year should bring some greater clarity to the Treasury Department’s financing plan and this may dampen the supply of Treasury bills and thereby reduce the upward trend in yields.
What we have been reading
Weekly market update – AMP

Dr Shane Oliver – Head of Investment Strategy and Economics and Chief Economist, AMP Investments | 13 Dec 2024
Global shares were mixed over the last week with a backup in bond yields and a bit of profit taking after a strong run up weighing on US and Eurozone shares leading to small falls. For the week US shares fell 0.6%, Eurozone shares fell 0.2% but Japanese shares rose 1%. Chinese shares fell 1% on the continuing lack of concrete fiscal stimulus details. Australian shares fell 1.5% for the week with profit taking after a strong run up, the lack of fiscal stimulus details from China and concerns shares may have run ahead of the likely outlook for earnings next year all weighing. Bond yields generally rose, particularly in the US as investors moved to factor in less Fed easing next year. Oil prices also rose on prospects for tighter sanctions on Russia and Iran but remain in the same $US0.67 to $US0.72 range they have been in for the last two months. Metal and iron ore prices rose slightly but gold prices fell. The $A fell slightly and the $US rose.
Geopolitical tensions continued over the last week with the fall of the Assad regime in Syria. It potentially weakens Russia and Iran, adds to the instability in the Middle East and runs the risk that it’s a case for the Syrian people of being tipped out of the frying pan and into the fire (as occurred with the removal of Sadam Hussein in Iraq). But its implications for investment markets are minimal as its not a big oil producer, just like Israel and Lebanon.
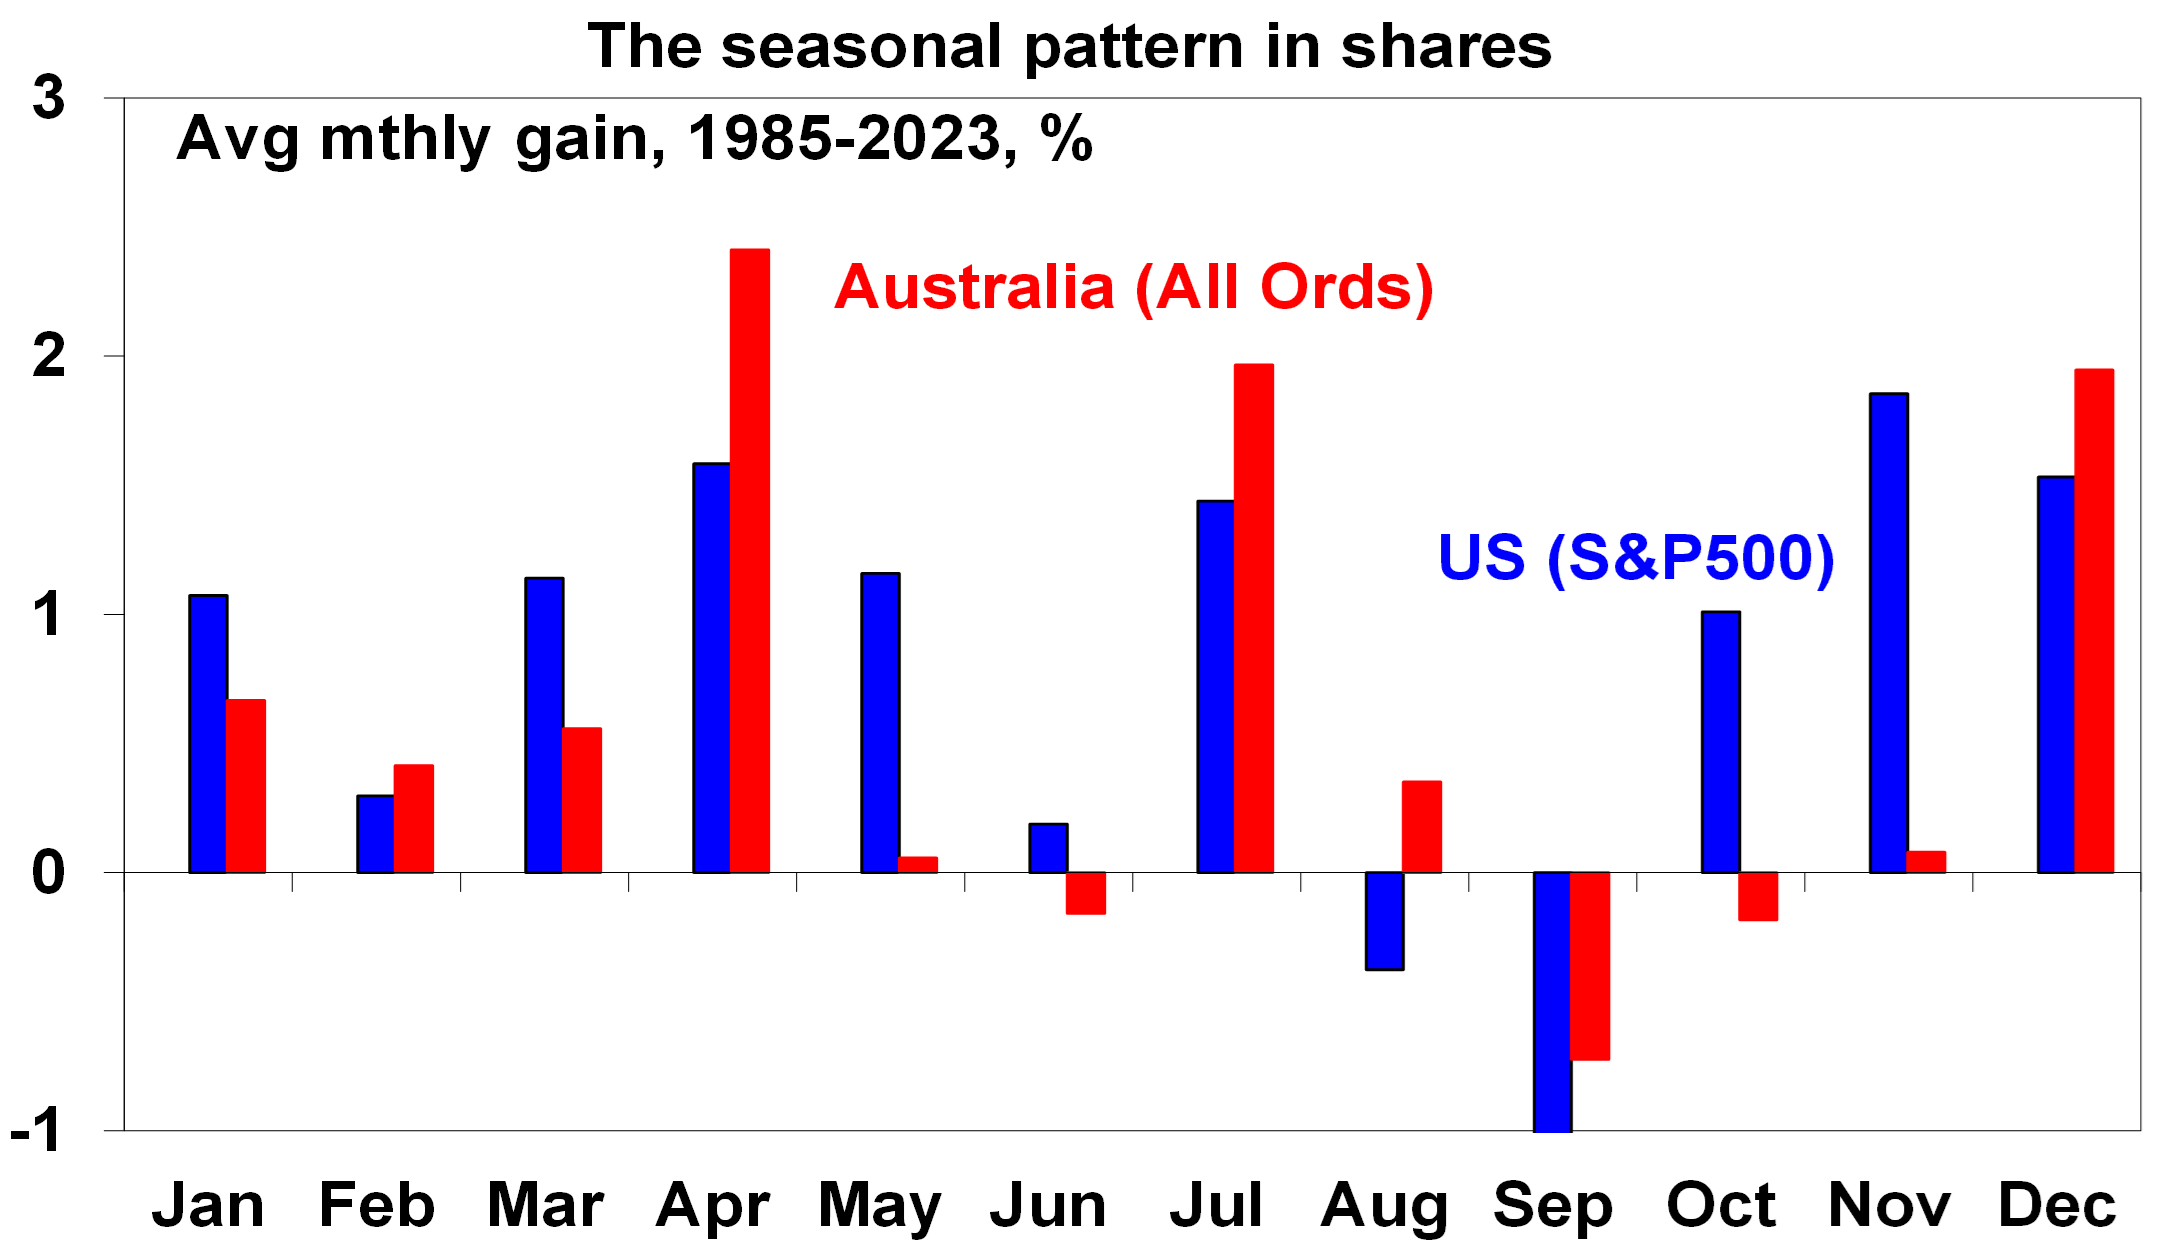
Shares remain torn between the negatives of rich valuations, higher bond yields, uncertainties as to how much central banks will cut rates or in Australia’s case when the RBA will cut, uncertainties around Trump’s trade policies and geopolitical risks on the one hand versus the positives of global central banks being in an easing cycle, goldilocks economic conditions particularly in the US, optimism that Trump will reinvigorate the US economy and prospects for stronger profits ahead in Australia. And we are now in a seasonally strong period of the year for shares. Our overall assessment remains that the trend is still up, including for Australian shares, but expect a more volatile and constrained ride over the year ahead.
It’s worth noting that while December is normally a seasonally good month for shares, the first half of the month is often a bit soft before strength kicks in over the Christmas period. But of course, it’s not guaranteed.
Source: Bloomberg, AMP
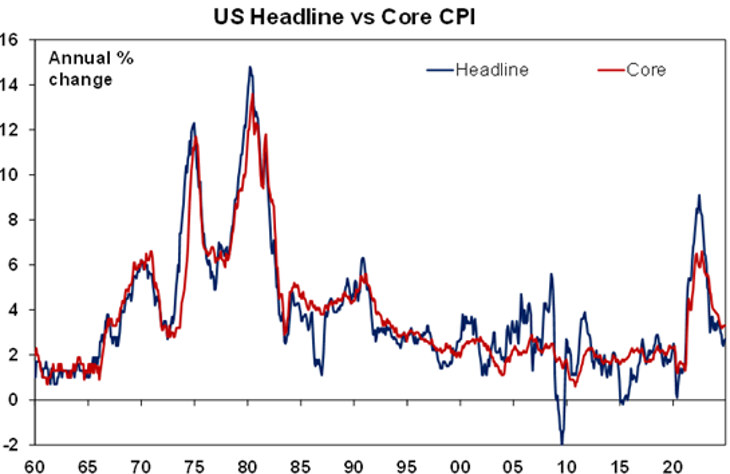
US inflation remained elevated in November. The bad news is that core CPI inflation has been stuck around 3.3%yoy for several months now, goods price inflation may be bottoming and the breadth of CPI increases above 3%pa has picked up a bit. The good news though is that rent inflation is slowing, services inflation is likely to slow further with unit labour cost growth now running around 2%yoy and the CPI and producer price inflation data suggests core private final consumption inflation for November of 0.15%mom or 2.9%yoy, which is okay.
Source: Bloomberg, AMP
But while US inflation remains a bit elevated, it was no worse than expected and slowing shelter inflation with a likely softer monthly core PCE rise will be viewed favourably by the Fed so another 0.25% rate cut is likely in the week ahead. However, expect a more gradual pace of easing next year.
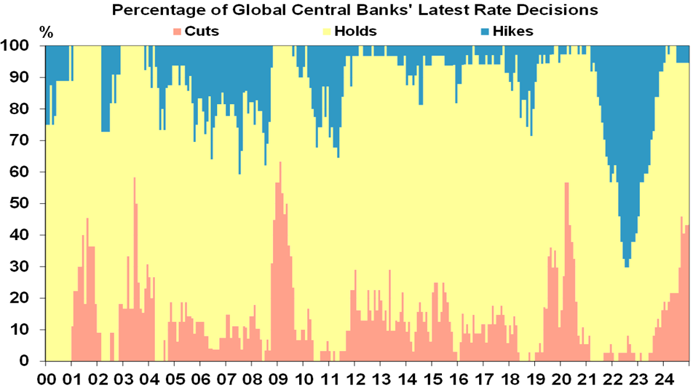
Meanwhile, the drum beat of global rate cuts continues with the Bank of Canada, the ECB and Swiss National Bank cutting rates again in the past week. The BoC cut by 0.5% to 3.25% and flagged a “more gradual approach” going forward. Nevertheless, with falling inflation, nearly 7% unemployment and threats to growth from US tariffs it’s expected to cut to 2.5% next year. The ECB cut its rates by 0.25% taking its deposit rate to 3% and moved more dovish by dropping a reference to keeping policy “sufficiently restrictive”. It’s likely to cut to 1.5% next year on the back of low inflation and weak growth with Trump’s tariffs not helping. The Swiss cut by 0.5% to just 0.5%, but its doubtful other central banks will get that low! Of global central banks latest decisions, around 45% have been to cut, around 50% have been to hold and only around 5% have been to hike.
Source: Bloomberg, AMP
In Australia, the RBA took a step towards preparing the ground for easing next year by shifting its commentary in a more dovish direction. While it left rates on hold at 4.35% it noted softer economic data and that its “gaining some confidence that inflation is moving sustainably towards target”. RBA guidance inevitably shifts around a bit because the RBA has to be flexible when the facts change so it’s dangerous to hang too much on to its guidance as its more an indication as to what it is thinking when provided as opposed to what it
will necessarily do.
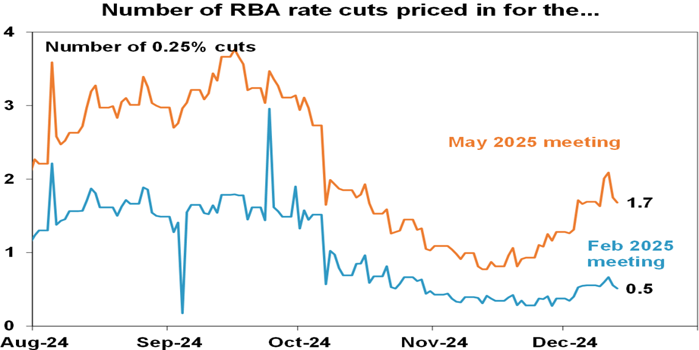
Is NAIRU lower than the RBA and most economists think? Two weeks ago, based on our assessment as to what we thought the RBA will do we shifted our expectation for the first rate cut from February to May and strong jobs data for November that saw unemployment fall back to 3.9% is arguably consistent with that so May remains our base case for the first cut. However, we remain of the view that the RBA should be cutting rates sooner rather than later as: the economy is coming in weaker than expected with an ongoing per capita recession; the strong November jobs data looks odd and prone to a reversal given soft job ads and business hiring plans; despite the low unemployment rate, wages growth is slowing as evident in both the official wages data along with evidence from enterprise agreements and advertised salaries on Seek – this suggests that the unemployment rate may actually be above NAIRU rather than below it!; and December quarter trimmed mean inflation is likely to slow to 0.6%qoq or less which is a pace consistent with the 2 to 3% inflation target. As a result, and along with the RBA’s more dovish guidance I don’t have a lot of confidence in the precise timing and see it as 50/50 as to whether the RBA will cut in February or wait till May. Much will depend on the next rounds of inflation, jobs and consumer spending data. Either way we see rates falling to 3.6% by the end of 2025.
The Australian money market is now back to a 50% probability of a February rate cut (down from 65% after the RBA meeting) and has 1.7 cuts priced in by May.
Source: Bloomberg, AMP
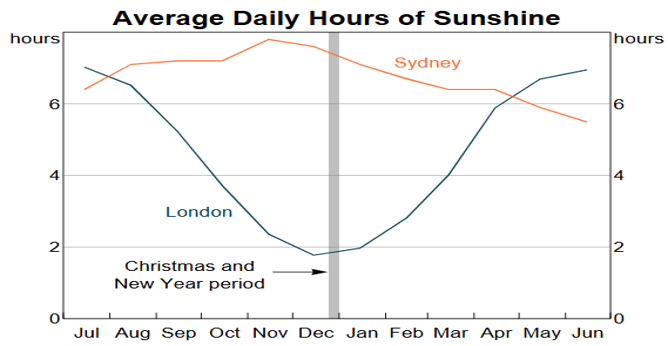
Tariffs and sunshine. RBA Deputy Governor Hauser had an interesting speech on Australia’s vulnerability to US tariffs. Australia’s direct exposure is modest given modest exports to
the US so the indirect effect is likely to be more significant. And here, while there are a lot of unknowns he seems to lean to the view that the drag on GDP may only be slight like 0 to -0.2% and that the impact on inflation is ambiguous. Maybe his best chart was the one below showing sunshine levels in London and Sydney. Its likely similar for many Australian cities and provides a key reason for Australians to be more cheerful than their UK counterparts.
Source: Australian Bureau of Meteorology, UK Met Office, RBA
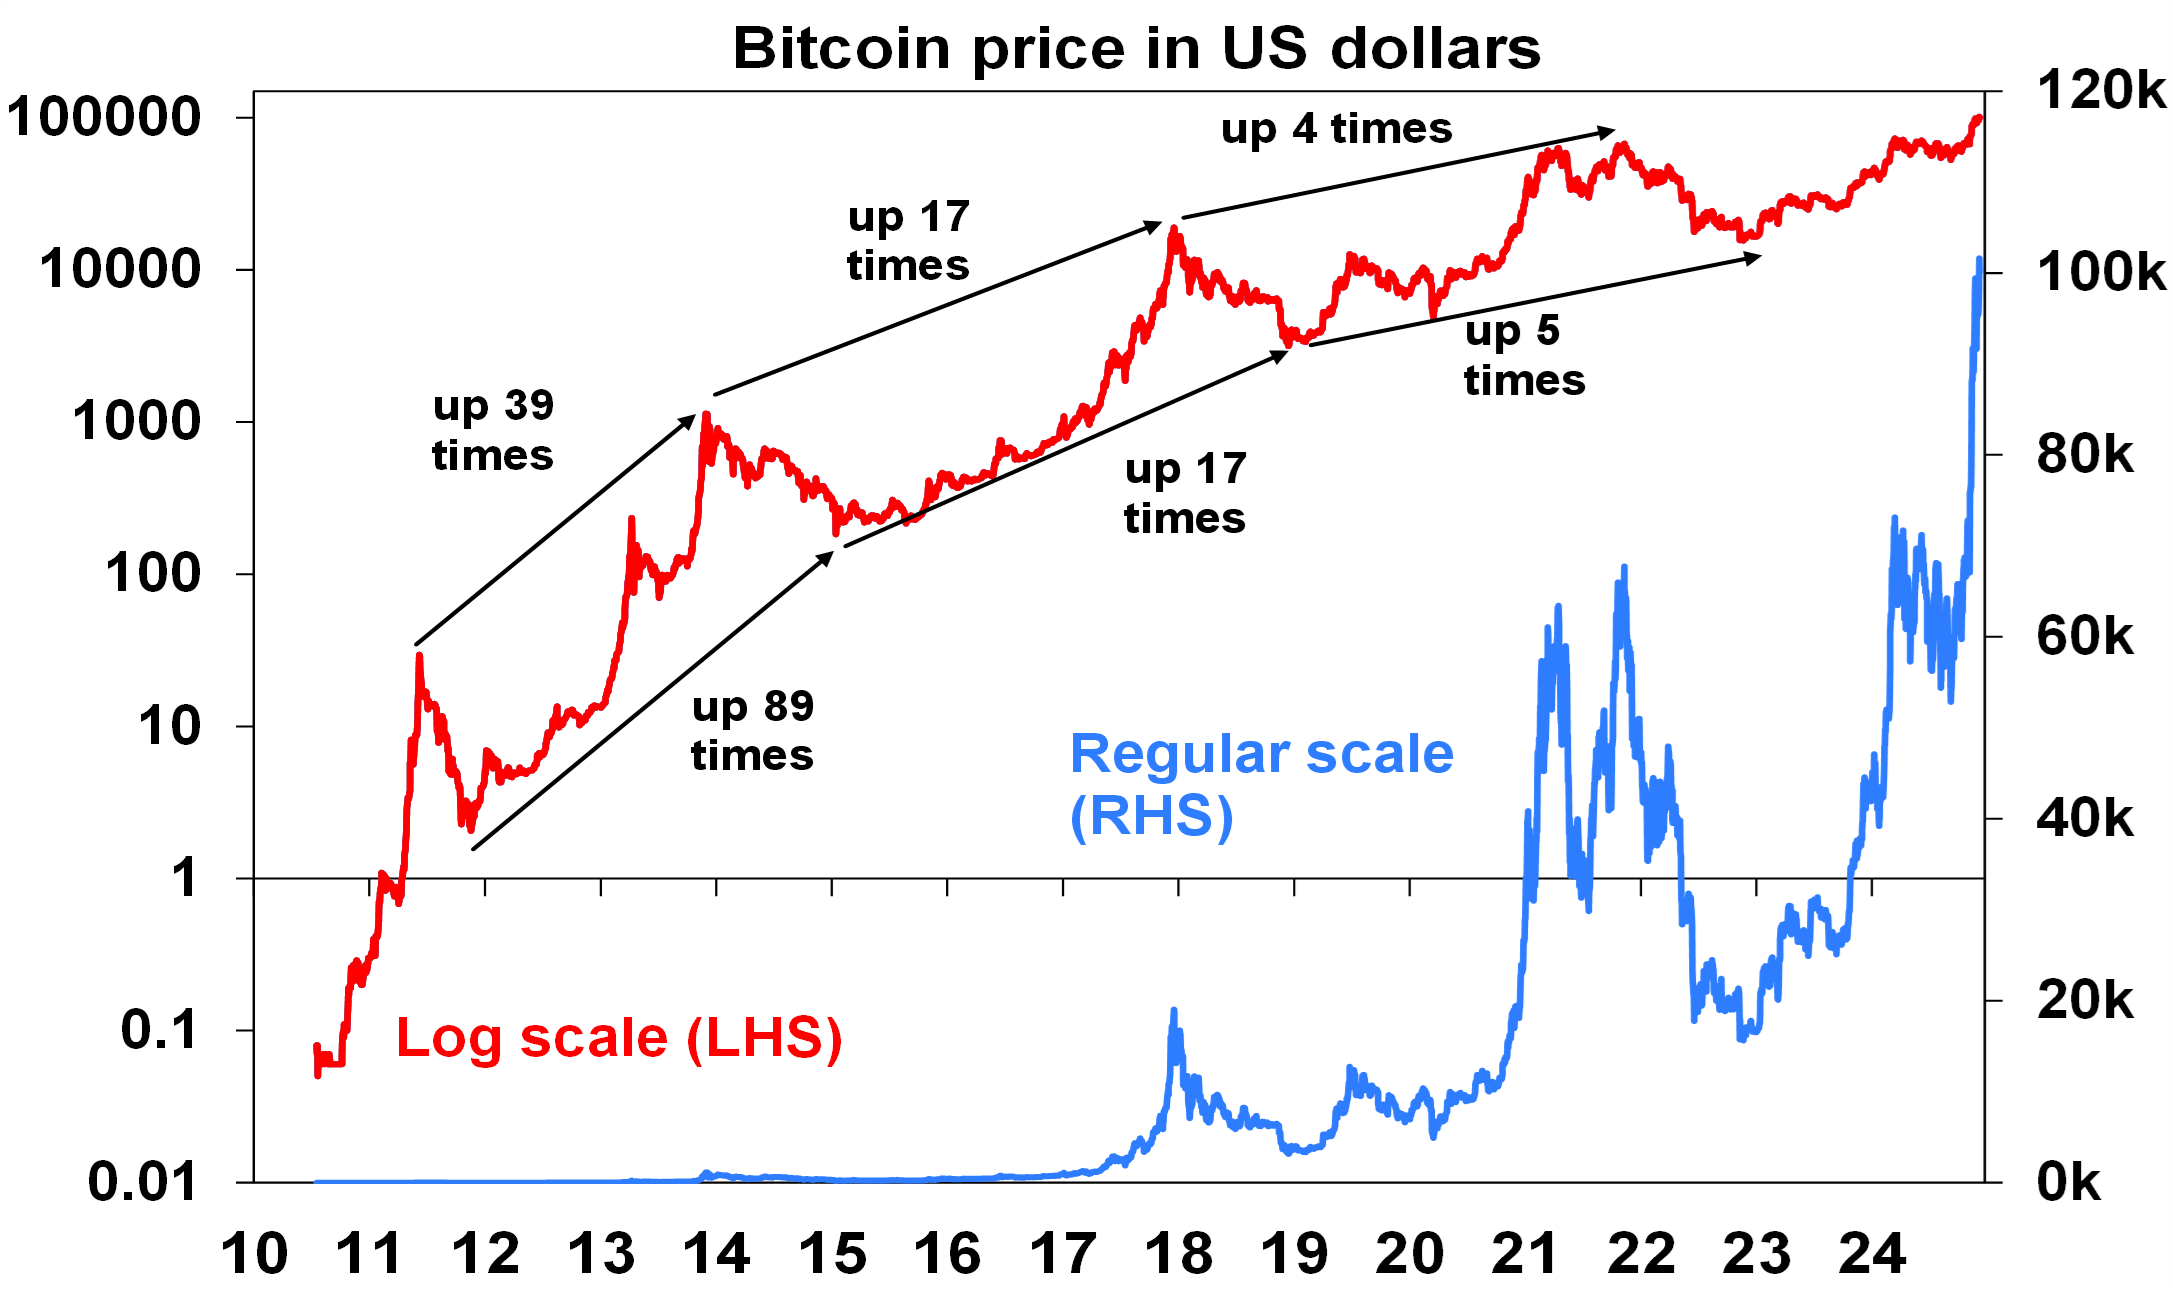
Seven things to bear in mind regarding Bitcoin. Bitcoin’s run up to $US100,000 has generated a lot of interest and it likely has more upside on the back of recent momentum and as it settles in as a form of “digital gold”. But there are seven key things investors need to bear in mind regarding it and wider crypto currencies:
- Bitcoin’s use case beyond an asset to speculate on remains unclear, unlike other cryptos like Ethereum.
- However, it is attracting money that might otherwise have gone to gold as investors seek an alternative non-confiscatable and independent of government asset.
- But since it produces no income flow (unlike rents for property or earnings for
shares) it’s impossible to value – similar to gold. - Bitcoin is highly volatile having had four 80% or so plunges in “crypto winters” since
its inception, and the same is likely again after the current run comes to an end, maybe next year.
Its increasingly correlated with shares with more than double the movements up and
down. - The gains in each upswing appear to be slowing as the easy gains are diminishing
over time. See the next chart. - But a 2 or 3 fold increase from the 2021 high would still take it to around $US135,000
to $US200,000!
Source: Bloomberg, AMP
Major global economic events and implications
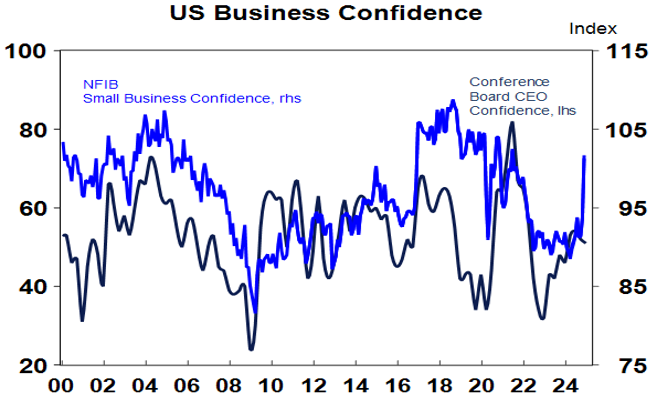
US small business optimism surged in November on the back of optimism that Trump will boost the US economy. Jobless claims rose in the last week but remain low.
Source: Macrobond, AMP
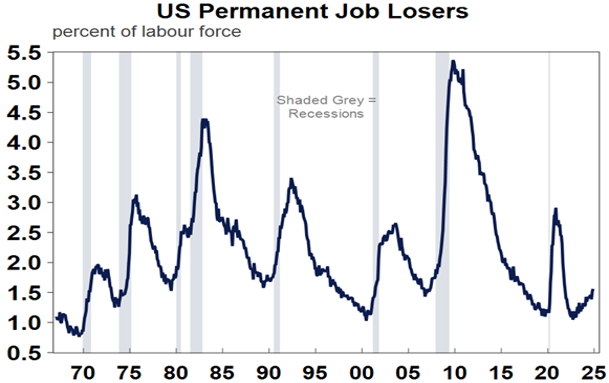
An interesting aspect of the November US jobs data is that permanent job losers as a percentage of the labour force are trending up consistent with the downtrend in job openings and quits in warning that the US labour market is still cooling. This in turn highlights the ongoing case for the Fed to cut rates further.
Source: Macrobond, AMP
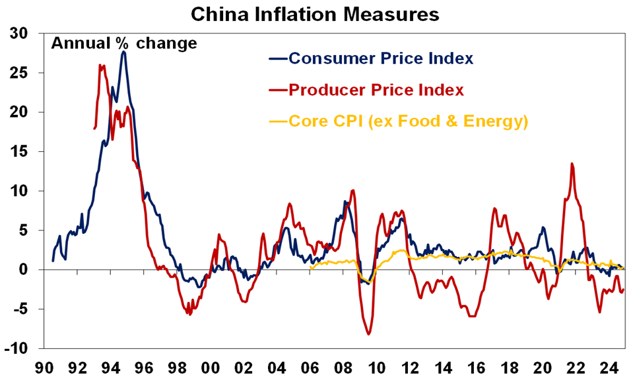
Stimulus talk in China is continuing with policy makers saying monetary policy will be “moderately loose”, fiscal policy “more proactive” and elevating the importance of boosting consumption but the details remain lacking. The need for more stimulus was highlighted by November data showing CPI inflation falling to just 0.2%, producer prices down 2.5%yoy and imports falling 3.9%yoy.
Source: Bloomberg, AMP
Australian economic events and implications
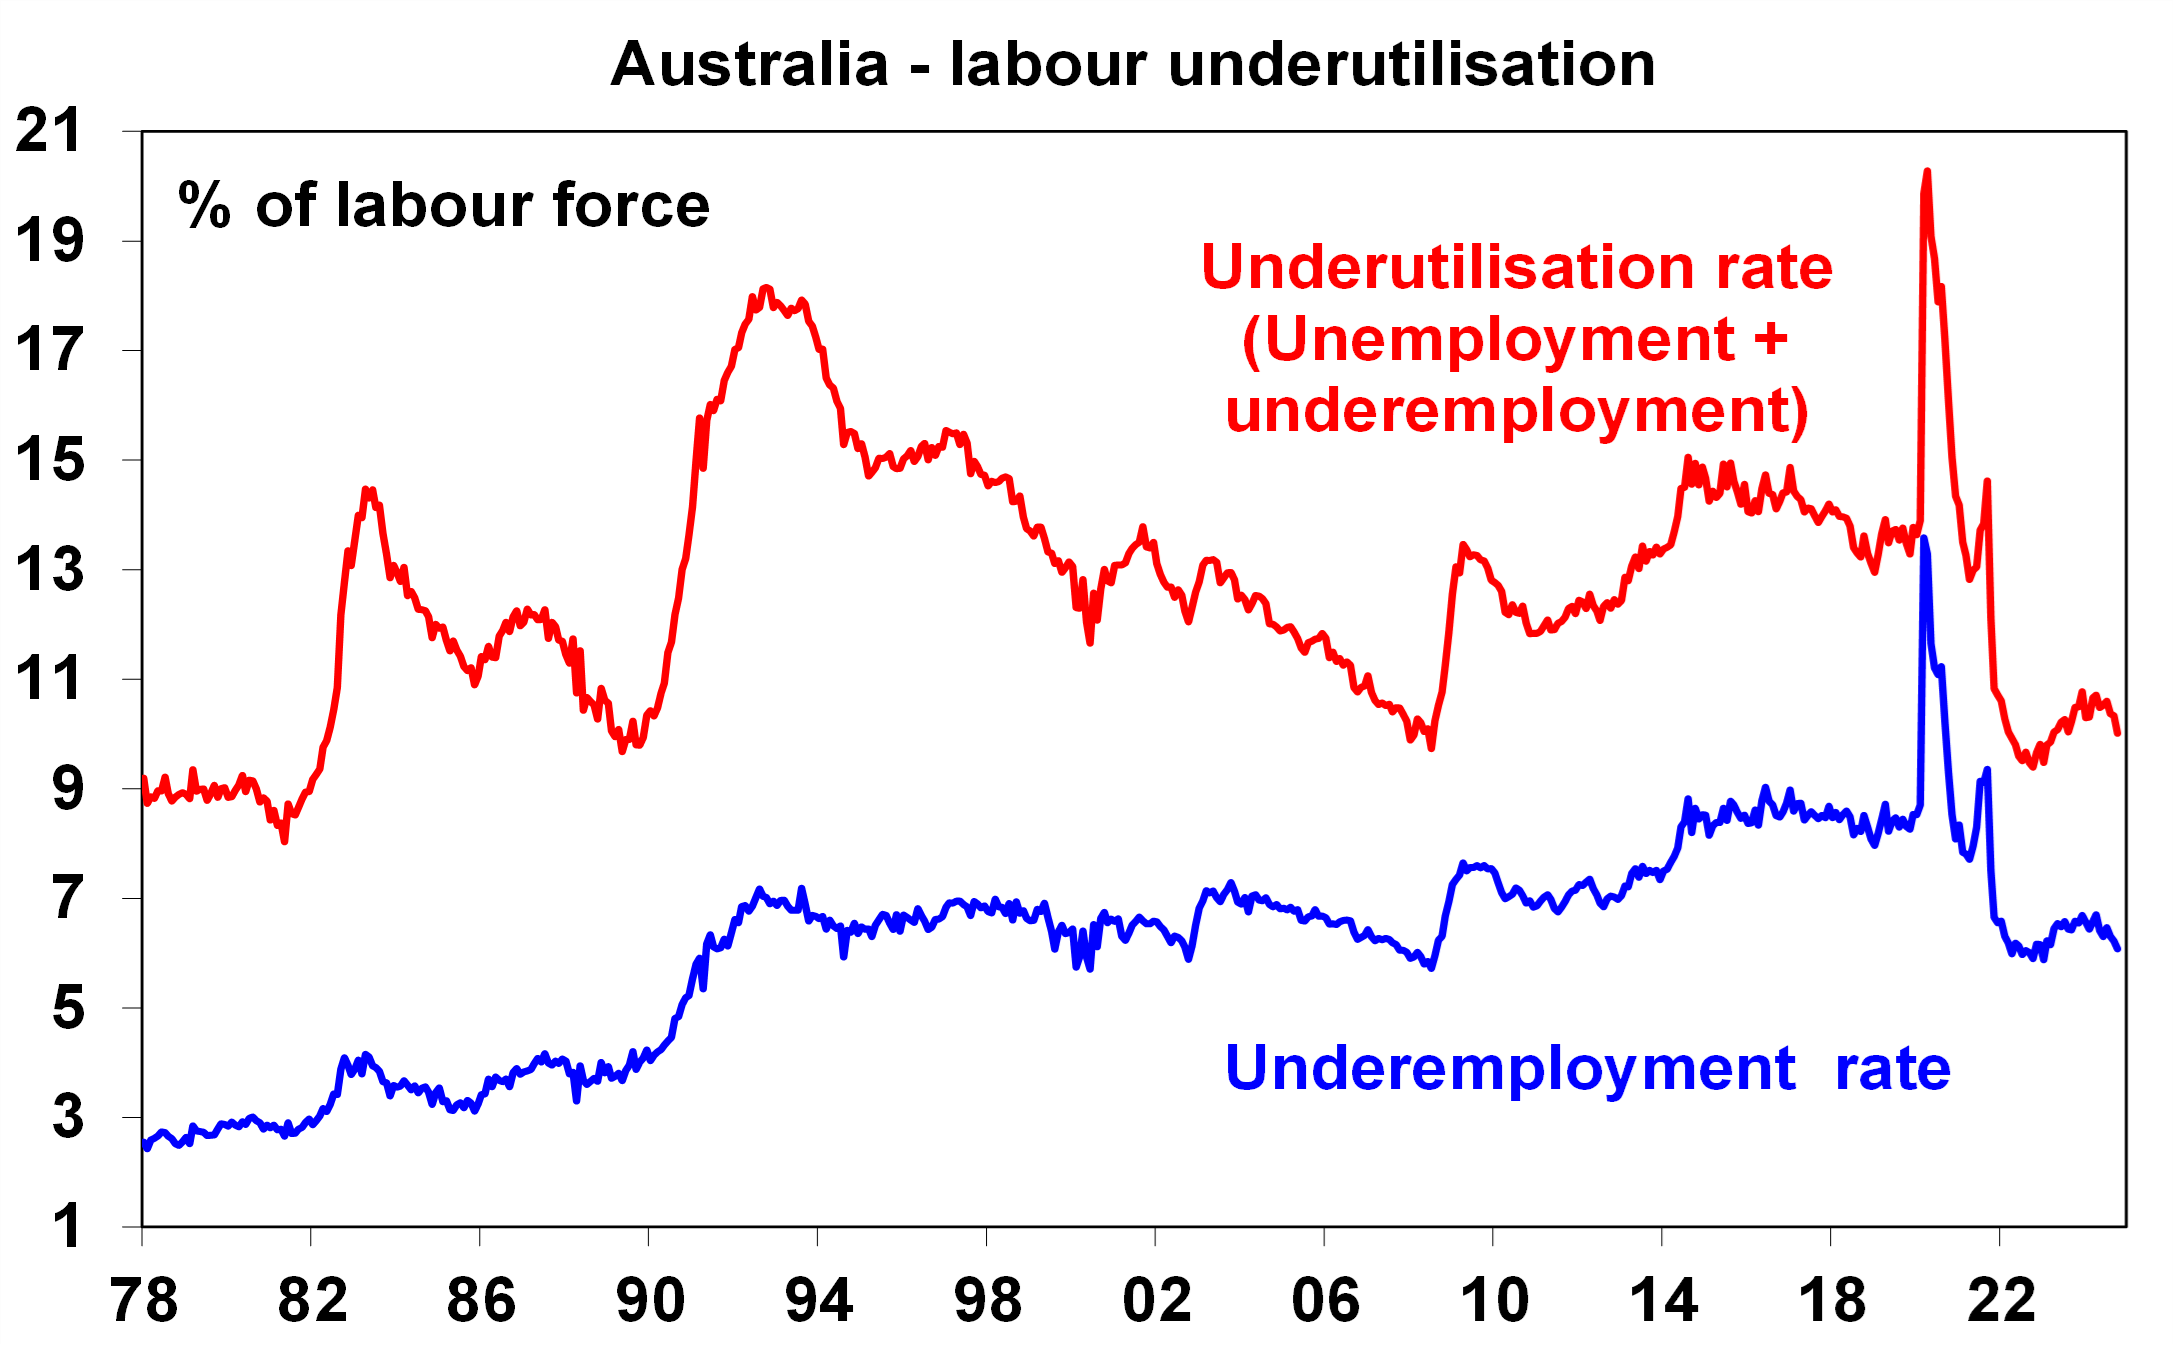
Surprisingly strong jobs data for November – but is it for real? November jobs data was far stronger than expected with employment up by 35,600 and unemployment back below 4% to 3.9% and labour market underutilisation rolling over again all suggesting the jobs market is tightening again.
Source: ABS, AMP
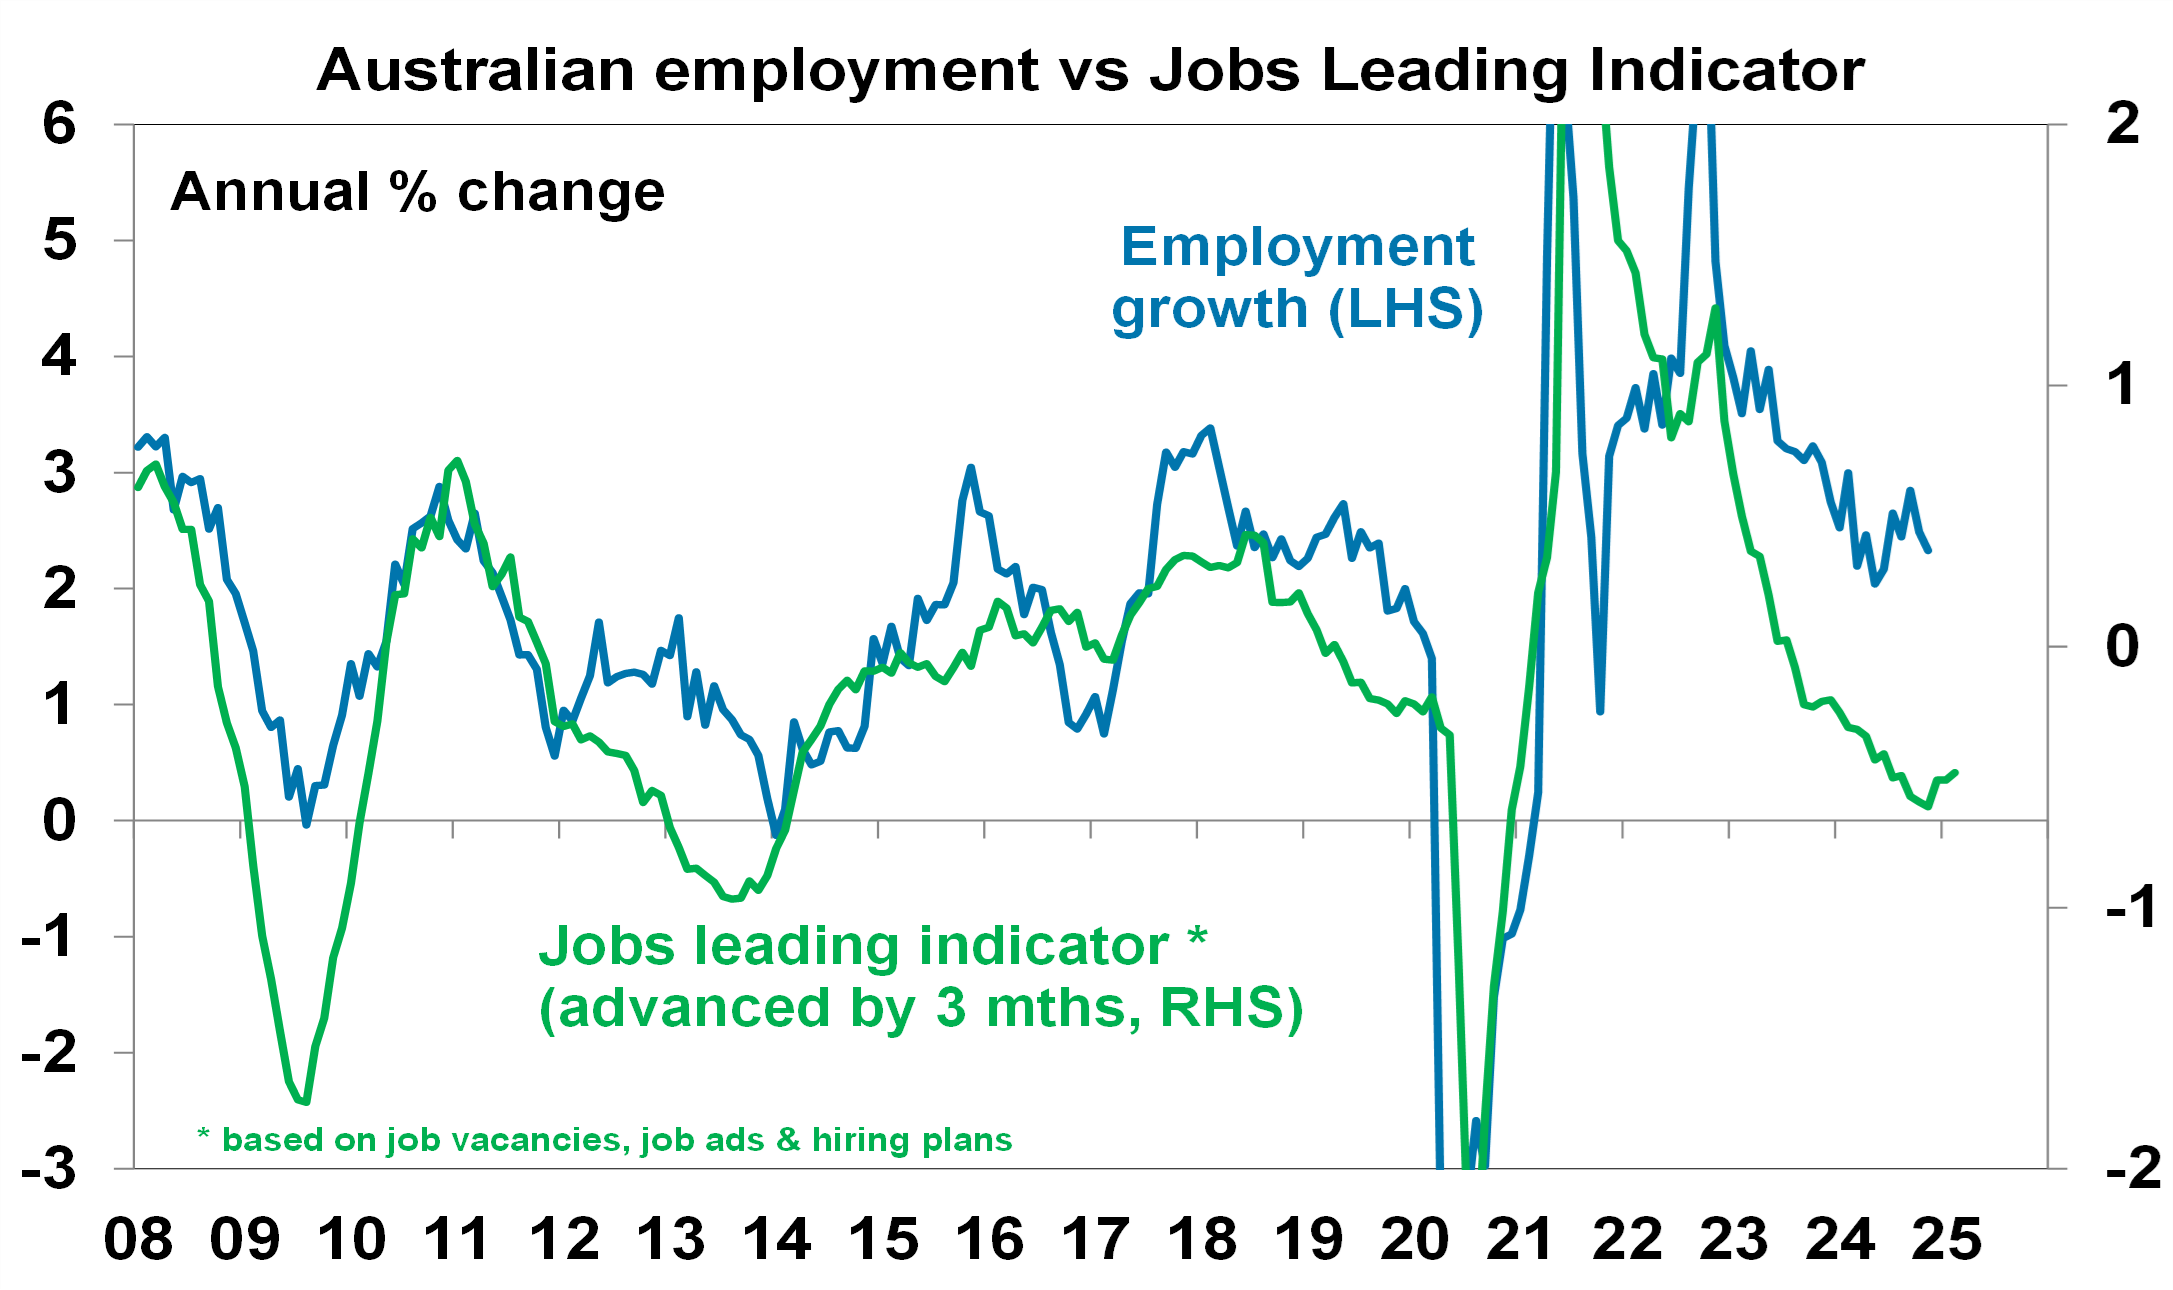
However, this is hard to square with the slump in GDP growth in the economy – with jobs growth at 2.4%yoy and hours worked growth at 2.1%yoy running well above GDP growth of 0.8%yoy (which is a horrible look for productivity) and with falling job vacancies and business hiring plans evident in our Jobs Leading Indicator. Maybe its due to ongoing strength in public sector employment and labour hoarding or maybe there’s a bit of statistical noise in there with the ABS noting “a higher than usual number of people moving into employment who were unemployed or waiting to start work”, which could reverse next month. Whatever, it is we are a bit sceptical and continue to expect softer jobs growth and higher unemployment ahead.
Source: ABS, AMP
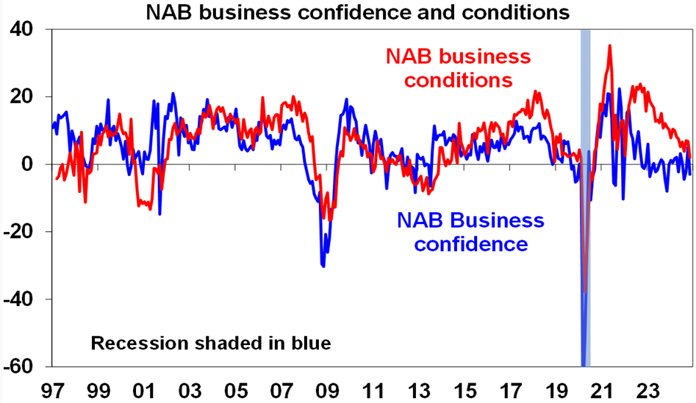
Going the other way was the November NAB business survey which showed falls in business conditions and confidence with conditions at their weakest since the pandemic.
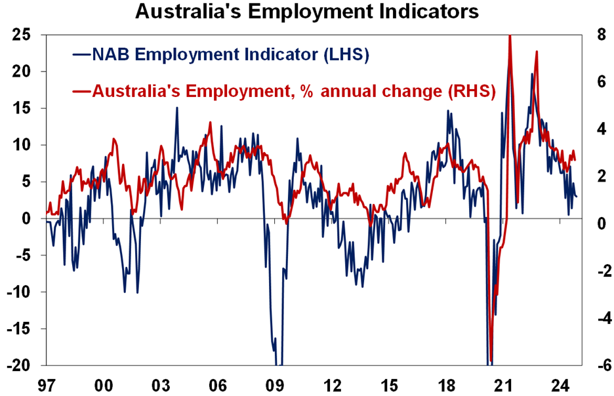
Orders remain weak and on the jobs growth employment plans still point to weaker jobs growth ahead.
Source: ABS, NAB, AMP
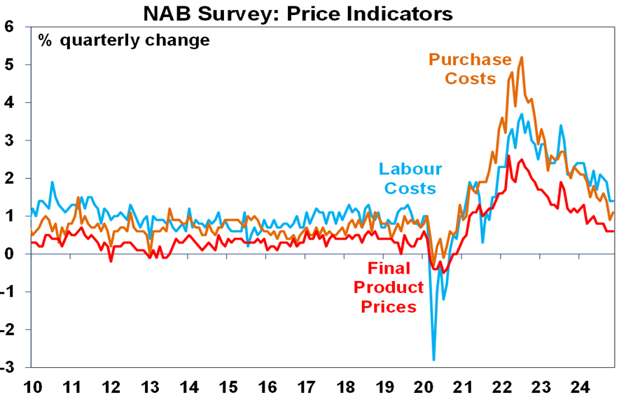
Meanwhile the NAB survey shows a further easing trend in cost and price pressures. Final product price growth is running at 0.6%qoq which is 2.4% annualised which is consistent with the RBA’s 2.5% inflation target.
Source: NAB, AMP
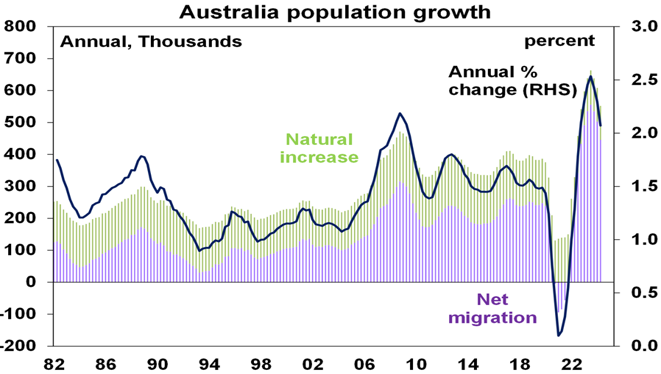
Australian population growth slowing at last but its still strong. Population growth slowed to 552,000 or 2.1% over the year to the June quarter from 638,400 or 2.5%yoy over the year to the June quarter last year as net migration slowed to 446,000. June quarterly net migration slowed to 63,155, its lowest in three years but the June quarter is often seasonally soft so it exaggerates the slowdown. The good news is that immigration is starting to come back under
control as student numbers normalise and tighter visa arrangements impact. But net migration last financial year still exceeded the May Budget forecast for 395,000. And total population growth last financial year of 552,000 implies we should have built around another 221,000 dwellings whereas dwelling completions were only around 176,000 implying an addition to the housing shortage of around 45,000 homes taking it to at least 200,000 homes nationwide.
Source: ABS, AMP
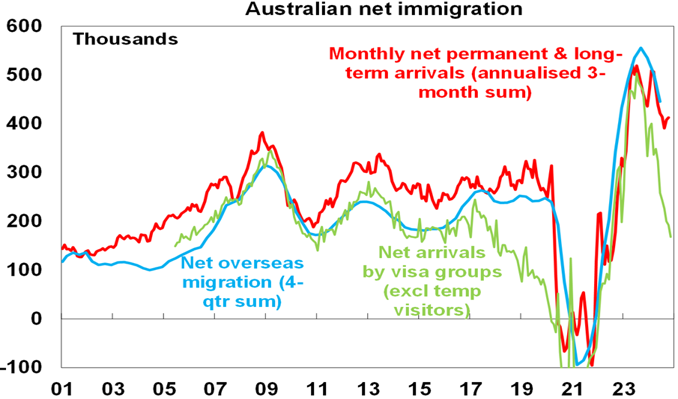
Monthly visa data excluding tourists and monthly net permanent and long term arrivals data point to a further slowing in net migration with the former suggesting a fall back to around pre-pandemic levels but the latter suggesting its still higher.
Source: Macquarie Macro Strategy, ABS, AMP
What to watch over the next week?
The week ahead will see business conditions PMIs released for November on Monday. These are likely to remain at okay levels on average but with strength in the US and softness in Europe, Japan and Australia and with services strong but manufacturing weak. Key to watch will be whether the broad-based weakness in manufacturing conditions flows through to
services.
In the US the focus will be on the Fed (Wednesday) which is expected to cut the Fed Funds rate by another 0.25% taking it to 4.25-4.5%. The dot plot of Fed officials interest rate expectations is expected to show 3 rate cuts next year, down from 4 in September. In other US data, expect a 0.5% rise in retail sales, a 0.2% rise in industrial production and still soft home builder conditions (all Tuesday), a 2% rise in housing starts (Wednesday) and a rise in core private final consumption inflation to 2.9%yoy (Friday).
Canadian inflation for November (Tuesday) is likely to fall to 1.9%yoy with underlying measures remaining around 2.4%yoy.
The Bank of England (Thursday) is expected to leave rates on hold at 4.75%, with dovish guidance. UK inflation for November (Wednesday) is likely to rise slightly to 2.6%yoy with core inflation rising to 3.6%yoy.
The Bank of Japan (Thursday) is expected to leave rates on hold at 4.25% with indications of another hike early next year. Japanese inflation data for November (Friday) is likely to show a rise to 2.9%yoy with core inflation rising slightly to 1.7%yoy.
Chinese economic activity data for November (Monday) is likely to show a further slight
improvement with retail sales growth expected to pick up to 5%yoy from 4.8%yoy.
In Australia, the Government’s Mid-Year Economic and Fiscal Outlook is likely to confirm a steep slide back into a budget deficit for this financial year and the years ahead as the “rivers of gold” flowing to Canberra from strong commodity prices and the strong jobs market slow and structural spending pressures impact. This year’s budget deficit forecast is likely to be around $25bn which is a bit smaller than the $28bn forecast back in the May Budget as budget data up to October show the budget tracking around $6bn better than expected. But subsequent years are likely to look worse as extra spending hits. The Treasurer is also likely to unveil more government spending with an extra $1.4bn or so in childcare spending already announced and even more under “decisions taken but not yet announced” to be unveiled ahead of the coming election, although he has said it won’t be “big spending”. The Government’s inflation forecasts are likely to be little changed but near-term
growth forecasts are likely to be revised down to around 1.5% for this financial year from 2%.
On the data front in Australia, consumer sentiment data (Tuesday) is likely to show a slight rise after dovish RBA commentary and housing credit growth (Friday) is likely to remain moderate.
Outlook for investment markets
Global and Australian shares are expected to return a far more constrained 7% in the year ahead. Stretched valuations after two strong years, the ongoing risk of recession, the likelihood of a global trade war and ongoing geopolitical issues will likely make for a volatile ride in 2025 with a 15% correction somewhere along the way highly likely. But central banks still cutting rates, with the RBA expected to start cutting in the first half 2025, and prospects for stronger growth later in the year supporting profits should still see okay investment returns.
Expect the ASX 200 to end 2025 at around 8,800 points.
Bonds are likely to provide returns around running yield or a bit more, as inflation slows to
target, and central banks cut rates.
Unlisted commercial property returns are likely to start to improve in 2025 as office prices have already had sharp falls in response to the lagged impact of high bond yields and working from home.
Australian home prices are likely to see further weakness over the next six months as high interest rates constrain demand and unemployment rises. Lower interest rates should help
from mid-year though and we see average home prices rising by around 3% in 2025.
Cash and bank deposits are expected to provide returns of over 4%, but they are likely to slow in the second half of 2025 as the cash rate falls.
The $A is likely to be buffeted between the positive of a narrowing in the interest rate differential between the Fed and the RBA and the negative of US tariffs and a potential global trade war. This could leave it stuck between $US0.60 and $US0.70.
What is the Santa Claus Rally, and How Could Gold Benefit?

Ainslie Bullion | Posted 16/12/2024|
Texas Attorney General Ken Paxton announced the launch of a lawsuit against investment giants BlackRock, Vanguard and State Street, joined by 10 other states, accusing the asset managers of using their positions in climate-focused investment initiatives to manipulate coal markets and drive up the cost of energy.
In statements received by ESG Today from BlackRock and State Street, the investment companies described the suit as “baseless,” with a BlackRock spokesperson adding that it “defies common sense.”
The announcement marks the latest in a series of moves in an ongoing anti-ESG movement by Republican politicians in the U.S. Texas has been one of the most active states in anti-ESG initiatives, with actions including having several asset managers placed on a list for potential divestment for allegedly “boycotting” energy companies, as well as joining a multi-state alliance to “protect individuals from the ESG movement,” through actions such as blocking the use of ESG in all investment decisions at the state and local level, and prohibiting state fund managers from considering ESG factors in their investments on behalf of the state.
Several Republican states have launched ESG-focused lawsuits over the past several months, often targeting BlackRock as the largest global investment management company, and a leading voice in the investment community on climate and energy transition-related investment themes, including Mississippi earlier this year, and Tennessee in December 2023.
In the new lawsuit, the Attorneys General claim that the asset managers acquired large shareholdings in major coal producers in the U.S., and used their combined influence to coerce the companies to cut coal production to accommodate clean energy investment goals, resulting in higher energy costs for U.S. consumers.
The suit notes that BlackRock, Vanguard and State Street collectively held substantial shares in major coal companies, including more than 30% stakes in Peabody Energy and Arch Resources, which together account for approximately 30% of the coal produced in the U.S. With the large holdings in place, the suit alleges that the firms violated the Clayton Act, which prohibits the acquisition of shares of companies in which ““the effect of such acquisition may be substantially to lessen competition.”
The suit adds that the firms “effectively formed a syndicate and agreed to use their collective holdings of publicly traded coal companies to induce industry-wide output reductions,” by joining the Net Zero Asset Managers Initiative (NZAM) in 2021, and with BlackRock and State Street also joining Climate Action 100+, noting that each initiative requires commitments from asset managers to engage with portfolio companies to align with climate goals, including the International Energy Agency’s (IEA) outlook that require CO2 emissions from coal to fall by 58% by 2030, and thermal coal output to fall 50% by 2030.
Notably, the asset mangers have since exited or significantly reduced their participation in the climate initiatives, often citing the group’s overly prescriptive requirements. For example, Vanguard exited NZAM in 2022, saying that it aimed “to make clear that Vanguard speaks independently on matters of importance to our investors,” and State Street left CA100+ earlier this year.
Similarly, BlackRock shifted its participation in Climate Action 100+ to its international unit, citing a new strategy by CA100+ that would require signatories to commit to use client assets to pursue emissions reductions in portfolio companies. In a letter to CA100+ published on the asset manager’s website, BlackRock said that “the money BlackRock manages is not our own—it belongs to our clients—and BlackRock is committed to providing clients around the world with choices to support their unique and varied investment objectives.” BlackRock’s website also carries a ‘2030 net zero statement,’ which states that “our role is to help them navigate investment risks and opportunities, not to engineer a specific decarbonization outcome in the real economy.”
Despite the asset managers’ decisions to leave the initiatives, however, the suit says that withdrawal “does not change the reality that Defendants’ holdings threaten to substantially reduce competition,” or “negate the ongoing and future threat of Defendants’ coordinated anticompetitive conduct or absolve Defendants of their legal liability for past violations.”
In a statement announcing the launch of the suit, the Texas AG’s office said:
“Deliberately and artificially constricting supply increased prices and enabled the investment companies to produce extraordinary revenue gains. This conspiracy violated multiple federal laws that prevent a major shareholder, or a group of shareholders, from using their shares to lessen competition or engaging in other anticompetitive schemes. Further, the companies broke Texas antitrust and deceptive trade practices laws.”
In the statement to ESG Today, BlackRock’s spokesperson said:
“BlackRock is deeply invested in Texas’ success. On behalf of our clients, we have billions invested in Texas energy, partnering with the state to attract investments into the Texas power grid and helping millions of Texans retire with dignity.
“BlackRock’s holdings in energy companies are regularly reviewed by federal and state regulators. We make these investments on behalf of our clients, and our focus is on delivering them financial returns.
“The suggestion that BlackRock has invested money in companies with the goal of harming those companies is baseless and defies common sense. This lawsuit undermines Texas’ pro-business reputation and discourages investments in the companies consumers rely on. “
State Street’s spokesperson said:
“State Street acts in the long-term financial interests of investors with a focus on enhancing shareholder value. As long-term capital providers, we have a mutual interest in the long-term success of our portfolio companies. This lawsuit is baseless and we look forward to presenting the facts through the legal process.”
Other states joining the suit include Alabama, Arkansas, Indiana, Iowa, Kansas, Missouri, Montana, Nebraska, West Virginia, and Wyoming.
Regards,
JMP Securities Team
JMP Securities
a. Level 3, ADF Haus, Musgrave St., Port Moresby NCD Papua New Guinea
p. PO Box 2064, Port Moresby NCD Papua New Guinea
Email: lars.mortensen@jmpmarkets.com
Ph: +675 7200 2233
Mobile: +675 7056 5124
Email: nathan.chang@jmpmarkets.com
Ph: +675 7167 3223
Mobile: +61 422 113 630