27 February, 2023
Welcome to this week’s JMP Report
Last week we saw three stocks trade on the local bourse BSP, KSL, and CCP. BSP had 176,557 shares trade, up 9 toea closing at K12.50 after a K1.4 Final Dividend announcement. KSL traded down 1 toea to K2.75 and CCP traded 1,121 shares unchanged at K1.90.
Refer details below
WEEKLY MARKET REPORT | 20 February, 2023 – 23 February, 2023
| STOCK | QUANTITY | CLOSING PRICE | CHANGE | % CHANGE | 2021 FINAL DIV | 2021 INTERIM | YIELD % | EX-DATE | RECORD DATE | PAYMENT DATE | DRP | MARKET CAP |
| BSP | 176,557 | 12.50 | 0.09 | 0.72 | K1.4000 | – | 13.53 | THUR 9 MAR 2023 | FRI 10 MAR 2023 | FRI 21 APR 2023 | NO | 5,317,971,001 |
| KSL | 200,811 | 2.75 | –0.01 | –0.36 | – | – | 9.93 | – | – | – | NO | 64,817,259 |
| STO | 0 | 19.10 | – | – | – | – | 2.96 | – | – | – | – | – |
| KAM | 0 | 0.95 | – | – | – | – | – | – | – | – | YES | 49,891,306 |
| NCM | 0 | 75.00 | – | – | USD$0.035 | – | – | FRI 24 FEB 23 | MON 27 FEB 23 | THU 30 MAR 23 | – | 33,774,150 |
| NGP | 0 | 0.69 | – | – | – | – | – | – | – | – | – | 32,123,490 |
| CCP | 1,121 | 1.90 | – | – | – | – | 6.19 | – | – | – | YES | 569,672,964 |
| CPL | 0 | 0.95 | – | – | – | – |
4.20 |
– | – | – | – | 195,964,015 |
Market Announcements
BSP Investor Presentation FY2022 – Download
Chairman Appointment / Resignation – Download
Dividend/Distribution – KSL. – Download
FY22 Appendix 4E. – Download
Dual listed stock
BFL – $5.10 +.29 (BSP declares final dividend of K1.40)
KSL – .775 + .005
NCM – 22.61 – 96c (NCM rejects offer)
STO – 7.01 +16c
Alternatives
Gold – 1811
Oil – 77
Platinum – 909
Lithium – 393500
Bitcoin – 23,464
Uthereum – 1,632
PAX Gold – 1,799
On the interest rate front we saw the 364 day bills bid aggressively with the weekly average at 2.65% leaving the market well over subscribed. I believe we will see the market bid down again next week. There has been no announcement this past week on the 2023 GIS schedule, but I believe an announcement is imminent. No changes to Finance Company money with 2% being the average for 12month deposit rates.
What we’ve been reading this week
Oliver’s insights – seven key charts for investors to keep an eye on
Dr Shane Oliver – Head of Investment Strategy and Economics and Chief Economist, AMP Investments
Key points
- We are reasonably upbeat on the outlook for investment markets this year, but it won’t be smooth sailing and after a strong start to the year share markets are vulnerable to a further pull back in the short term given ongoing issues around inflation, interest rates, recession and geopolitics.
- Seven key charts worth keeping an eye on remain: global business conditions PMIs; US inflation and our Pipeline Inflation Indicator; unemployment & underemployment; inflation expectations; earnings revisions; the gap between earnings yields and bond yields; and the US dollar.
Introduction
Shares had a strong start to the year seeing gains into early February around or above what we expect for the year as a whole. But we still expect that it will be a volatile year given that: the process of getting inflation back down won’t be smooth; the topping process in central bank rates will take time with setbacks along the way as we have seen for both the Fed and the RBA recently; recession risks are high; raising the US debt ceiling around the September quarter won’t be smooth; and geopolitical risks around Ukraine, China (as highlighted by the balloon over the US) and Iran (which is getting close to nuclear weapon breakout capacity) are significant. With shares becoming overbought after the new year rally and seasonality turning less positive, shares both globally and in Australia are vulnerable to more of a pull back in the short term. This note updates seven charts we see as critical for the investment outlook.
Chart # 1 – global business conditions PMIs
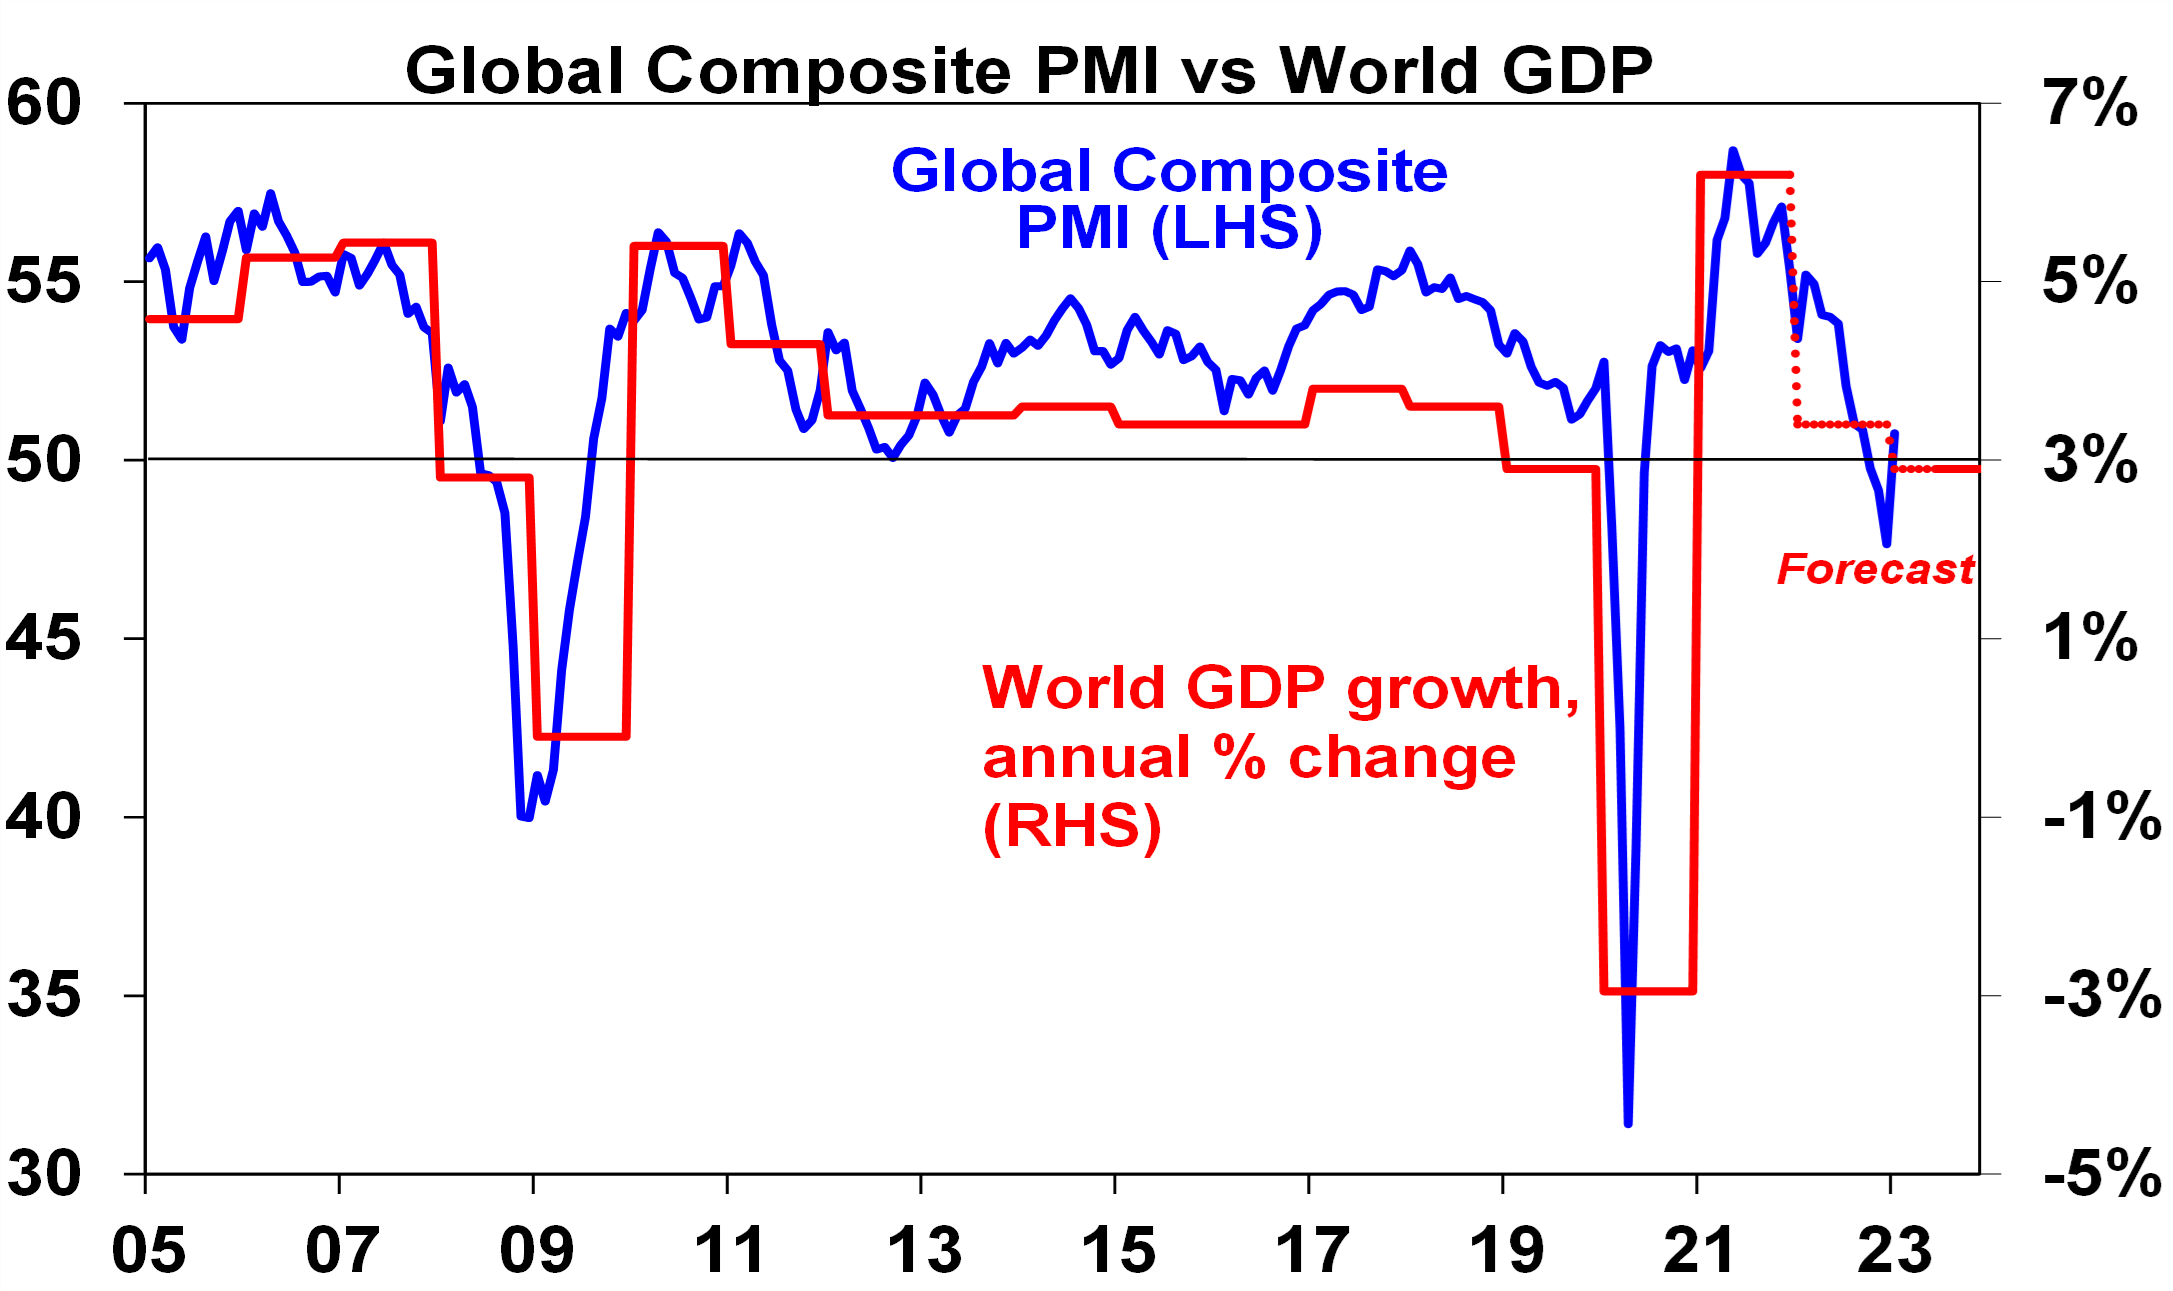
Whether share markets fall back to new lows and resume the bear market in US and global shares that started last year will be crucially dependent on whether major economies slide into recession and, if so, how deep that is. Our assessment is that global growth will be around 2.5-3% this year. Global Purchasing Managers Indexes (PMIs) – surveys of purchasing managers at businesses – will be a key warning indicator.
Source: Bloomberg, AMP Capital
They have slowed but are not at levels associated with recession. In January they rose, helped by China’s reopening. So far, they still look ok.
Chart 2 (and 2b) – inflation
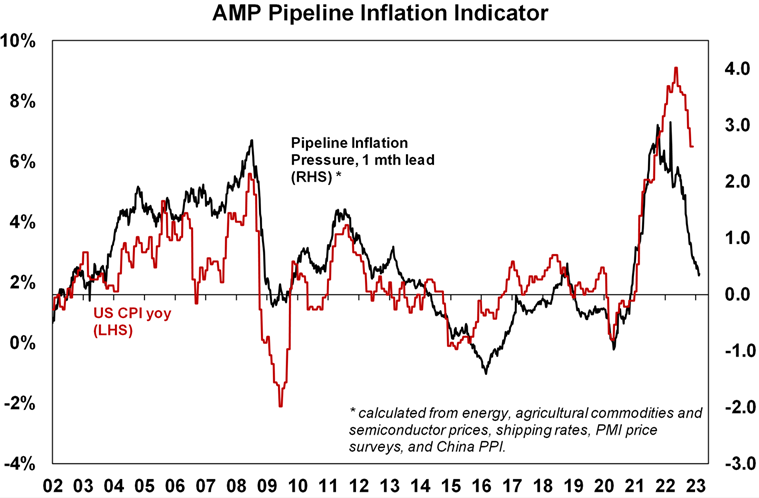
A lot continues to ride on how far key central banks raise interest rates. And the path of inflation will play a key role in this. Recently the news has been better with inflation rates in key countries rolling over. US inflation is well down from its high last year and our US Pipeline Inflation Indicator – reflecting a mix of supply and demand indicators – has been falling, pointing to a further fall in inflation. The key is that US inflation continues to fall – if so, this should allow the Fed to stop hiking in either March or May and it could find itself needing to cut rates from later this year.
Source: Bloomberg, AMP
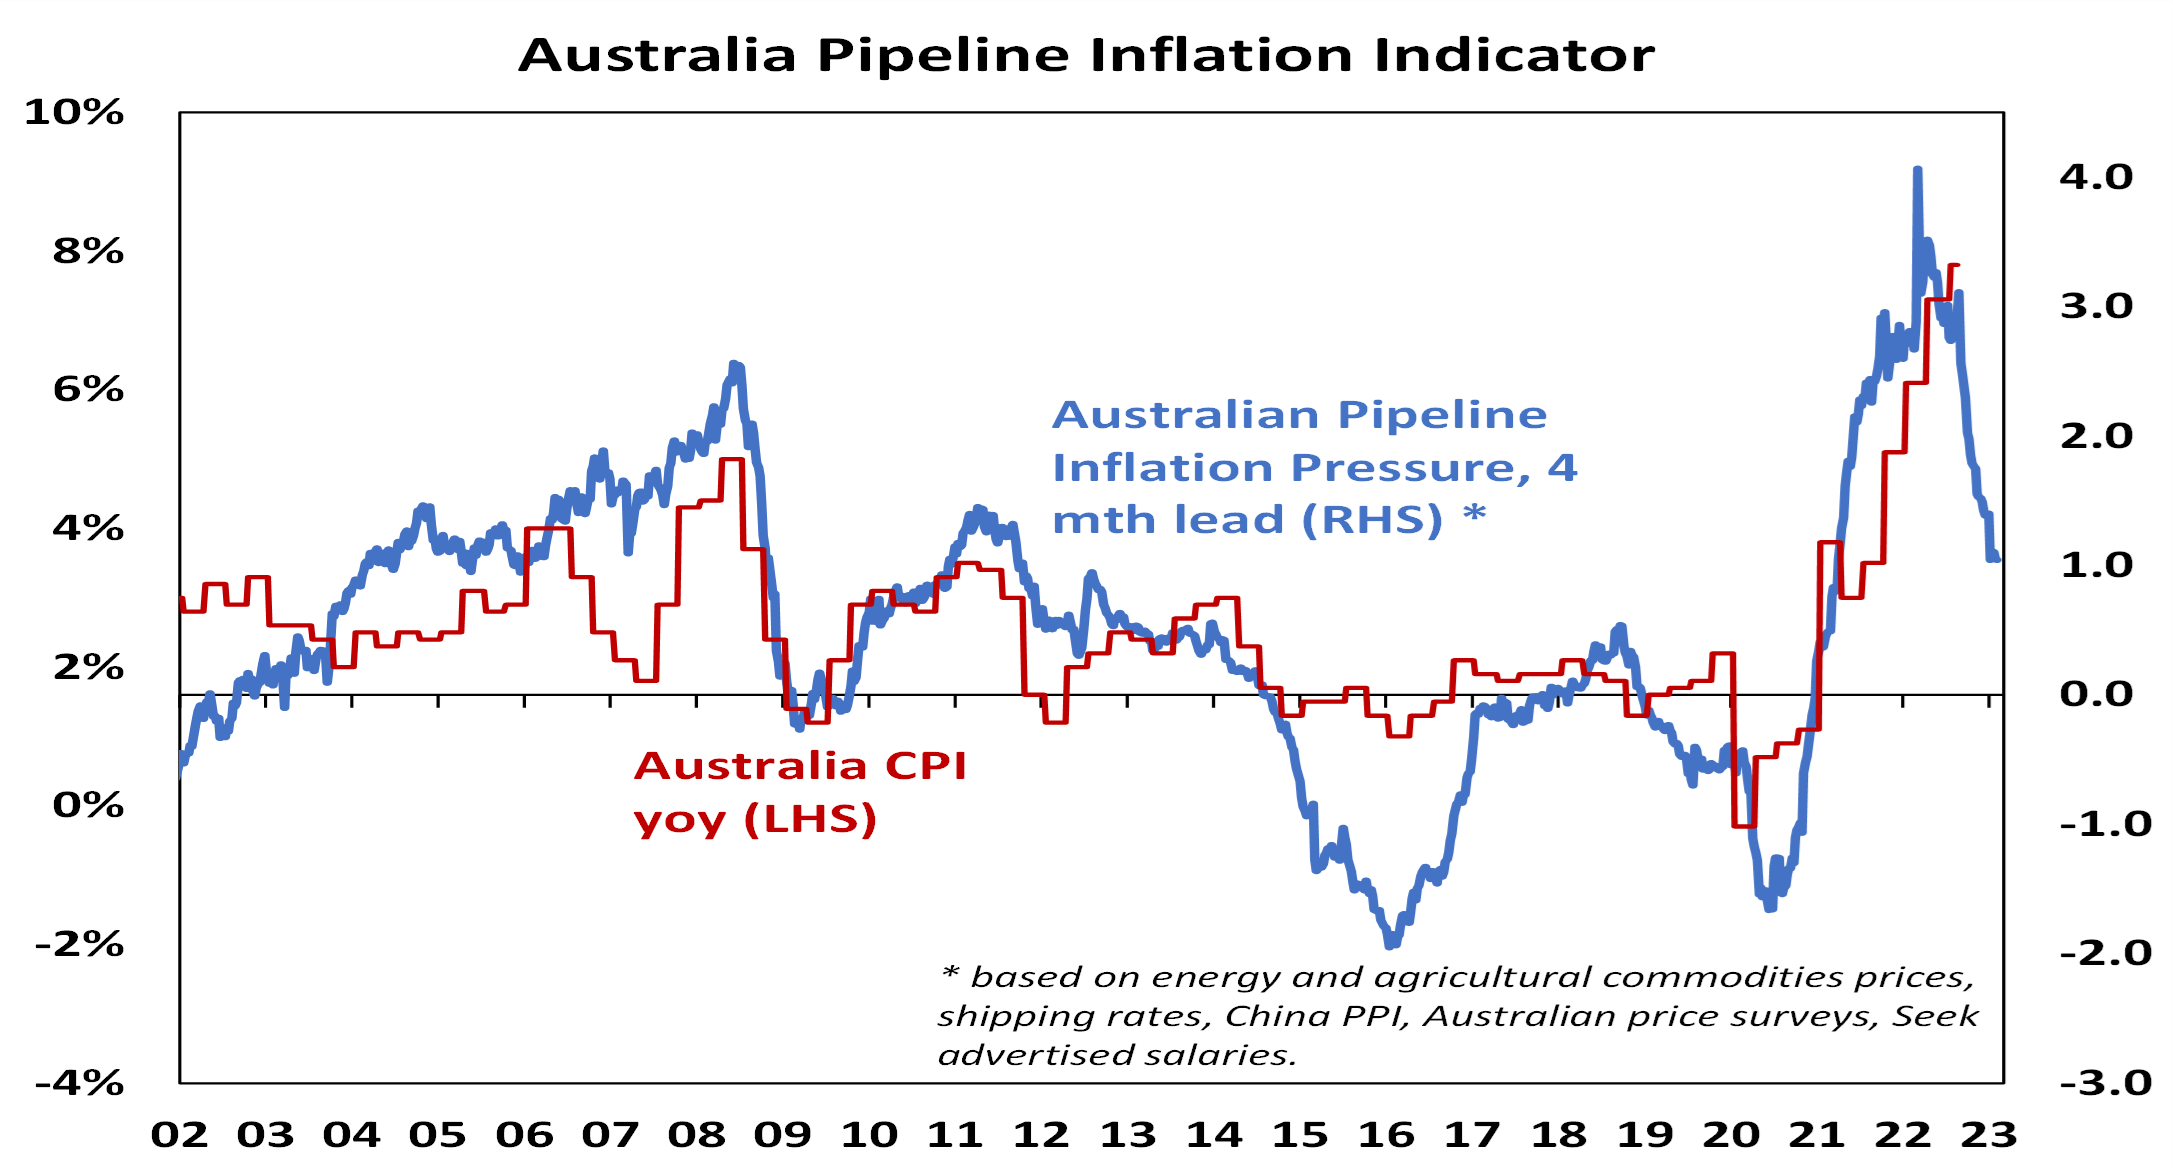
Our Australian Pipeline Inflation Indicator also suggests that Australian inflation has peaked and will fall through this year, albeit Australian inflation and the RBA are lagging the US and the Fed.
Source: Bloomberg, AMP
Chart 3 – unemployment and underemployment
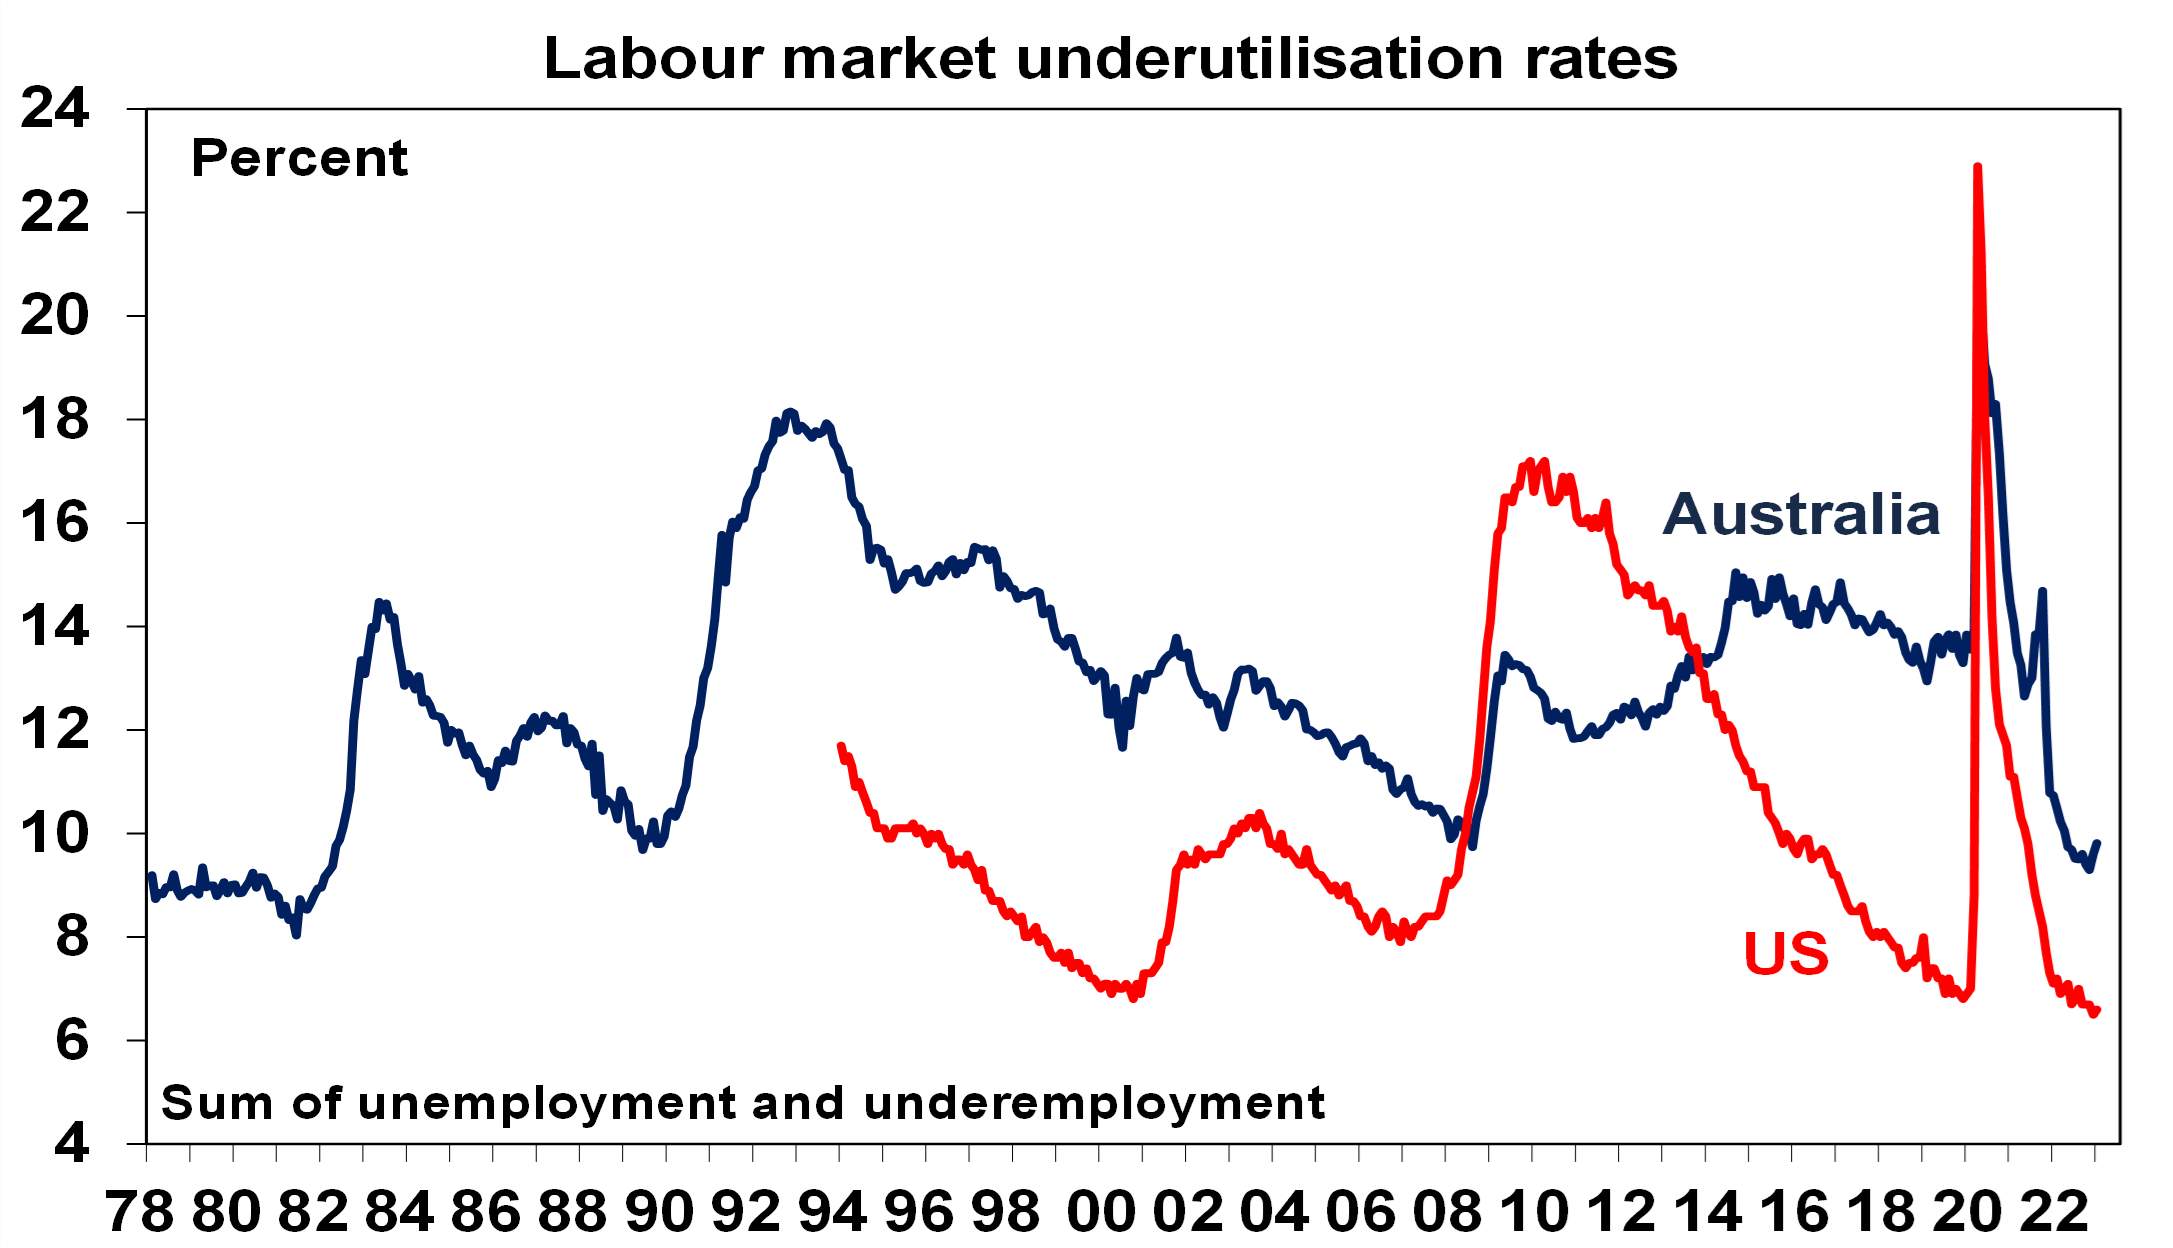
Also critical is the tightness of labour markets as this will help drive wages growth. If wages growth accelerates too far it risks locking in high inflation with a wage-price spiral which would make it hard to get inflation down. Unemployment and underemployment are key indicators of this. Both remain very low in the US & Australia (putting upwards pressure on wages), but there is some evidence that labour markets have seen the best and may now be slowing. And wages growth in the US looks to have peaked.
Source: Bloomberg, AMP
Chart 4 – longer term inflation expectations
The 1970s experience tells us the longer inflation stays high, the more businesses, workers and consumers expect it to stay high & then they behave (in terms of wage demands, price setting & tolerance for price rises) in ways which perpetuate it. The good news is that short term (1-3 years ahead) inflation expectations have fallen lately in the US and longer-term inflation expectations remain low. The latter is consistent with 2% or so inflation & suggests the job of central banks should be far easier today than say in 1980 when the same measure was around 10% and deep recession was required to get inflation back down. The key is that it stays low.
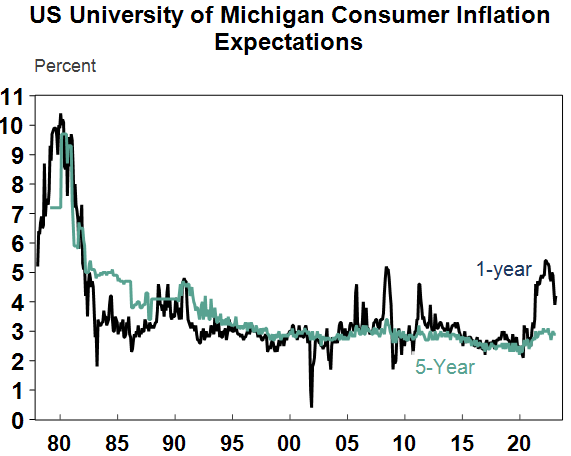
Source: Macrobond, AMP
Chart 5 – earnings revisions
Consensus earnings growth expectations for this year are around 11% for the US and around 7% for Australia. They look a bit too high, but a deterioration on the scale seen in the early 1990s, 2001-03 in the US and 2008 would be bad news. So far so good.
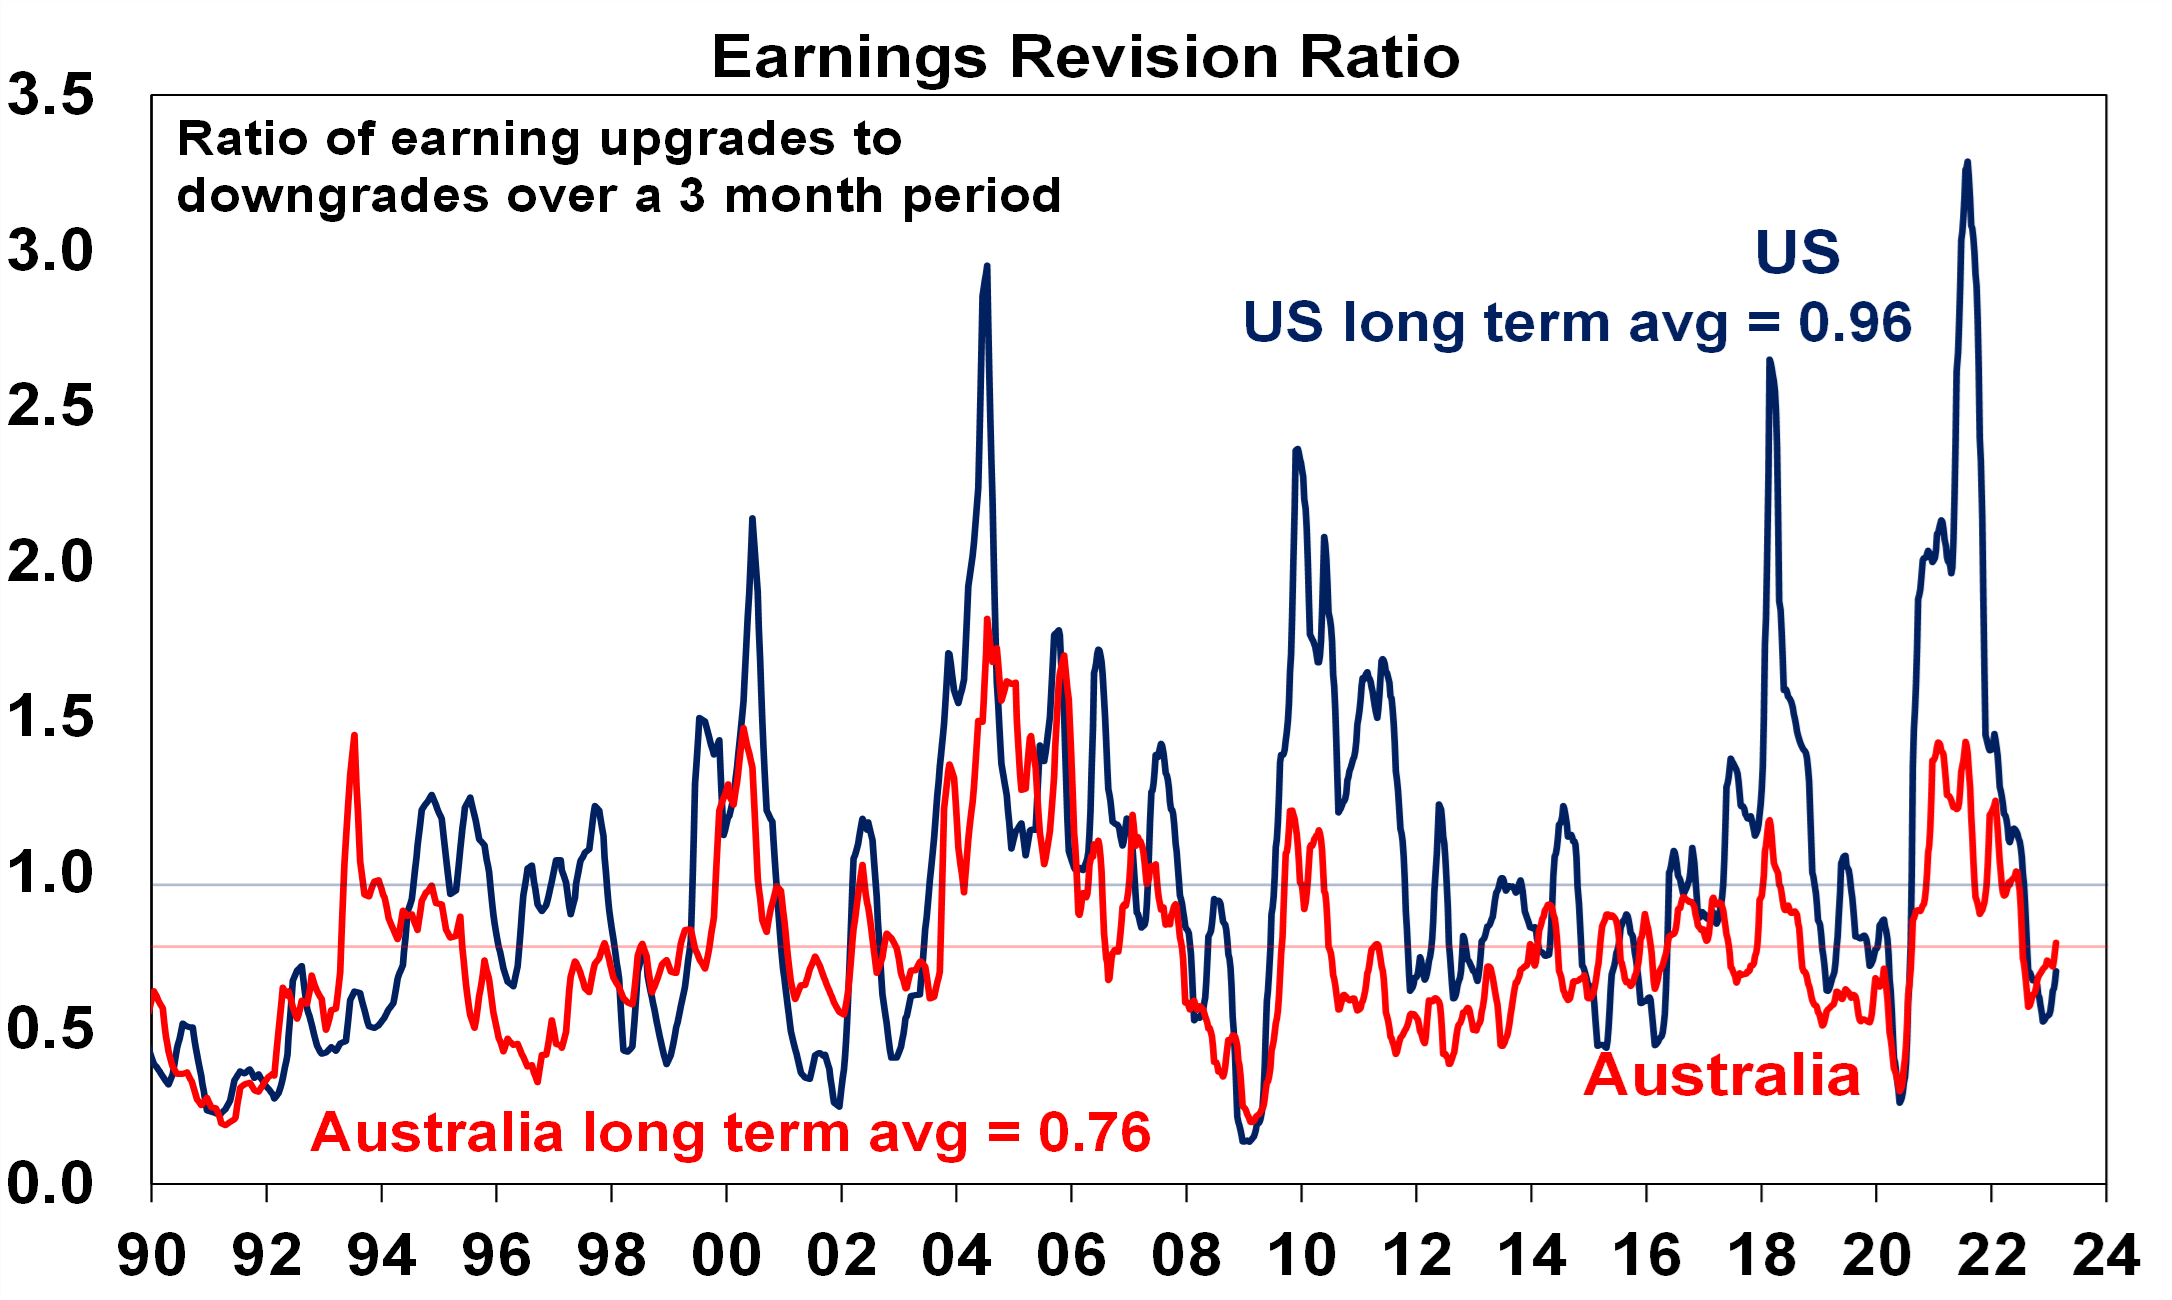
Source: Reuters, AMP
Chart 6 – the gap between earnings and bond yields
Over the last year rising bond yields have weighed on share market valuations. As a result, the gap between earnings yields and bond yields (which is a proxy for shares’ risk premium) has narrowed to its lowest since the GFC in the US. Compared to the pre-GFC period shares still look cheap. Australian share valuations look a bit more attractive than those in the US though helped by a higher earnings yield. Ideally bond yields need to continue to decline and earnings downgrades need to be limited in order to keep valuations okay.
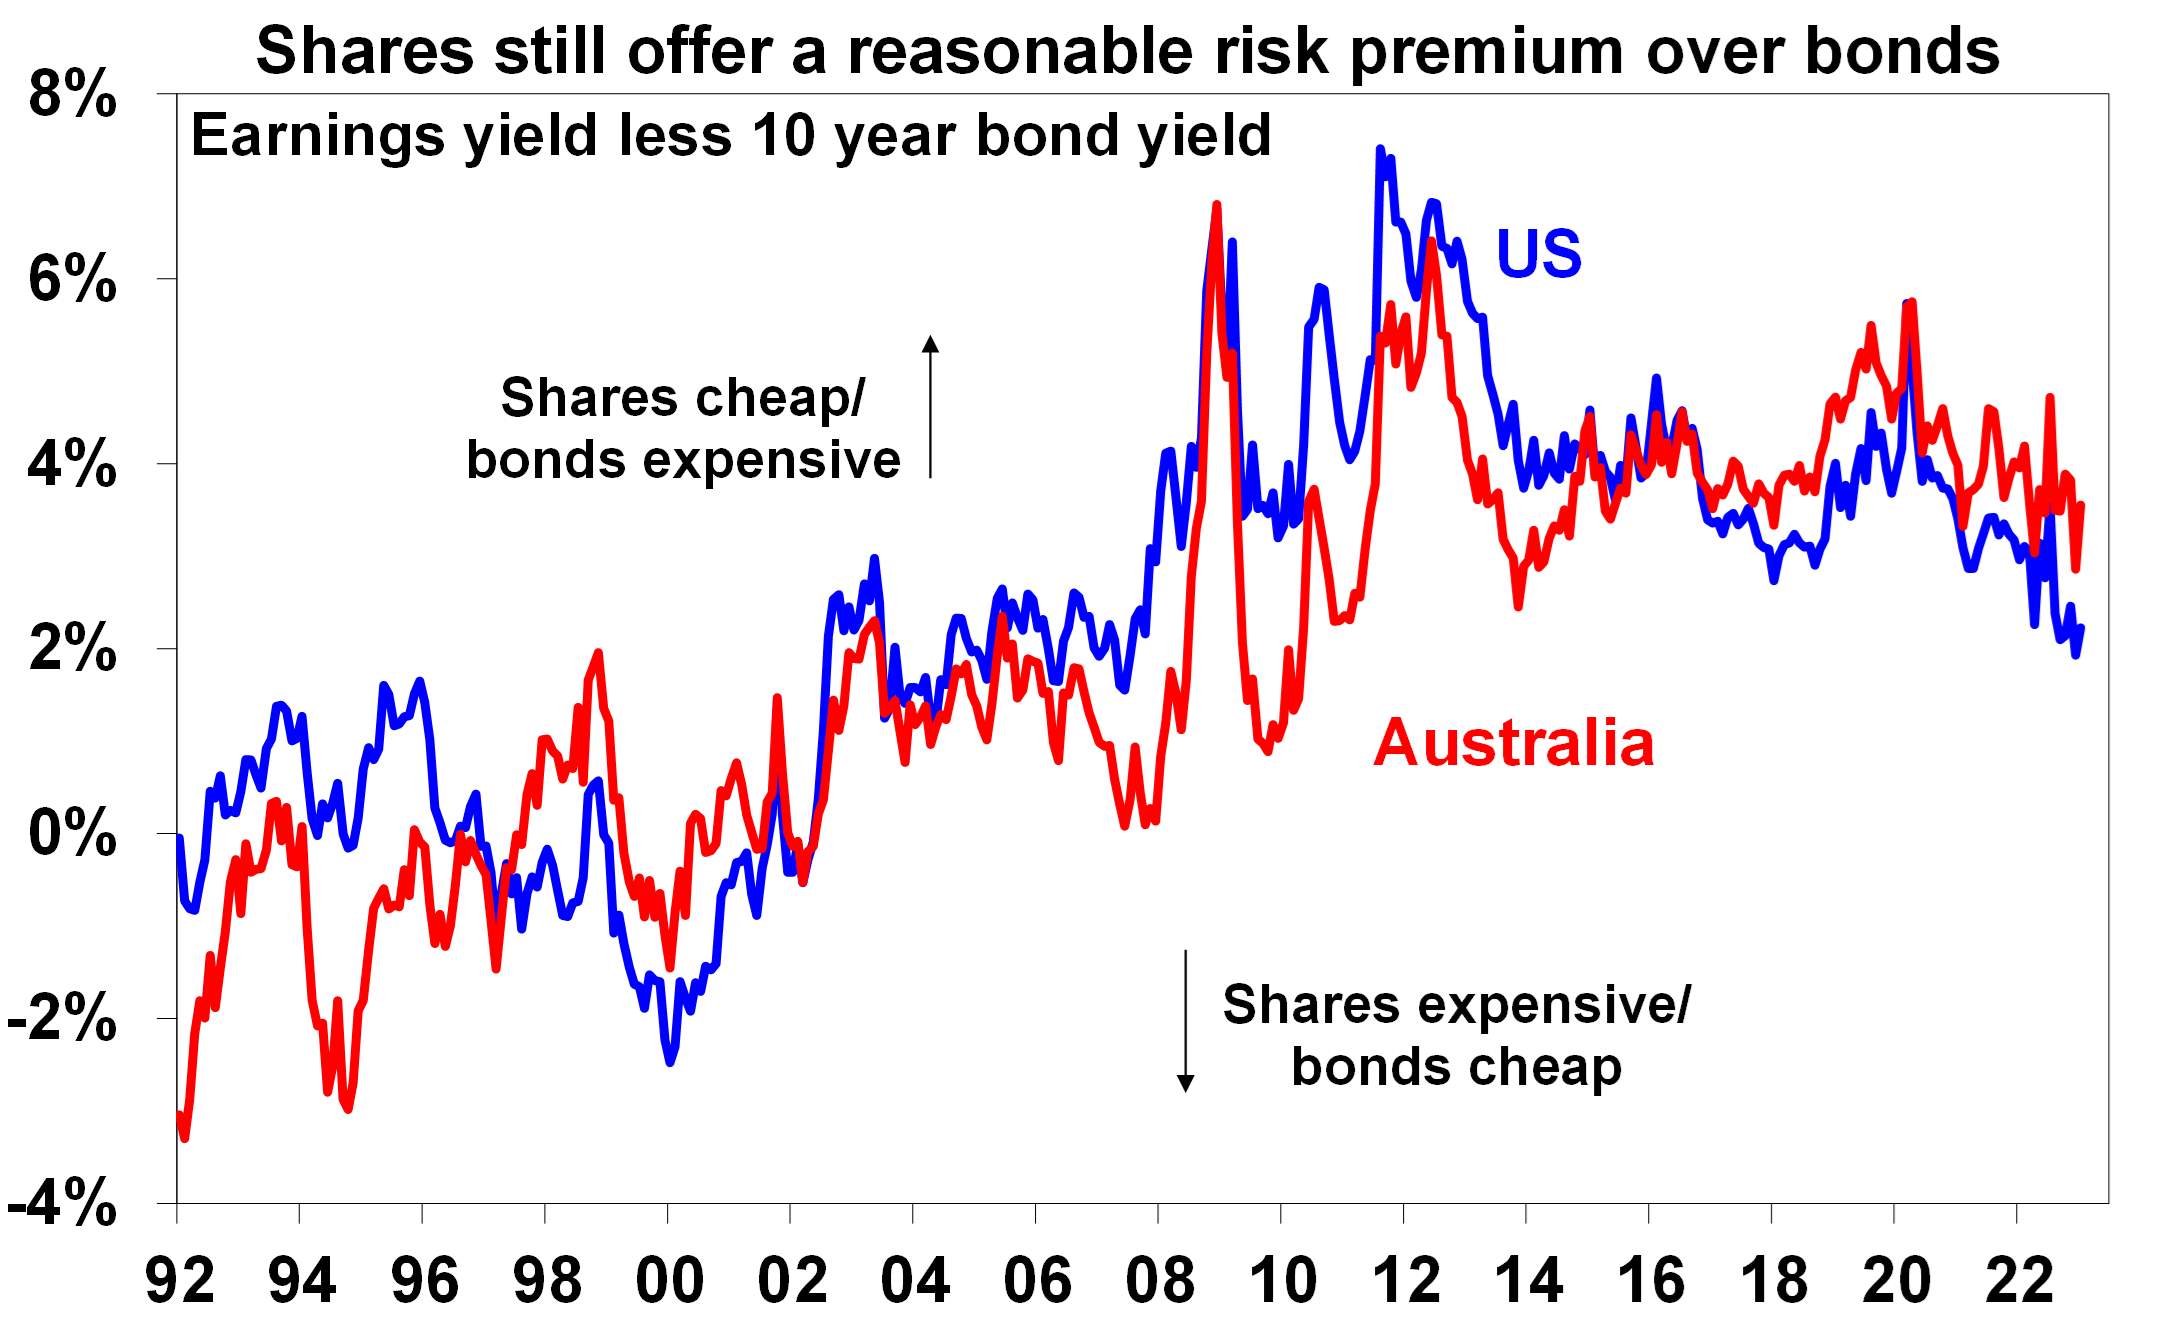
Source: Reuters, AMP
Chart 7 – the US dollar
The US dollar is a counter cyclical currency, so big moves in it are of global significance and bear close watching as a key bellwether of the economic and investment cycle. Due to the relatively low exposure of the US economy to cyclical sectors, the $US tends to be a “risk-off” currency, ie, it goes up when there are worries about global growth and down when the outlook brightens. Last year the $US surged with safe haven demand in the face of worries about recession and war and more aggressive monetary tightening by the Fed. Since September though it has fallen back as inflation and Fed rate hike fears have eased and geopolitical risks receded a bit. A further fall in the $US would be consistent with our reasonably upbeat view of investment markets this year, whereas a sustained new upswing would suggest it may be vulnerable. So far so good.

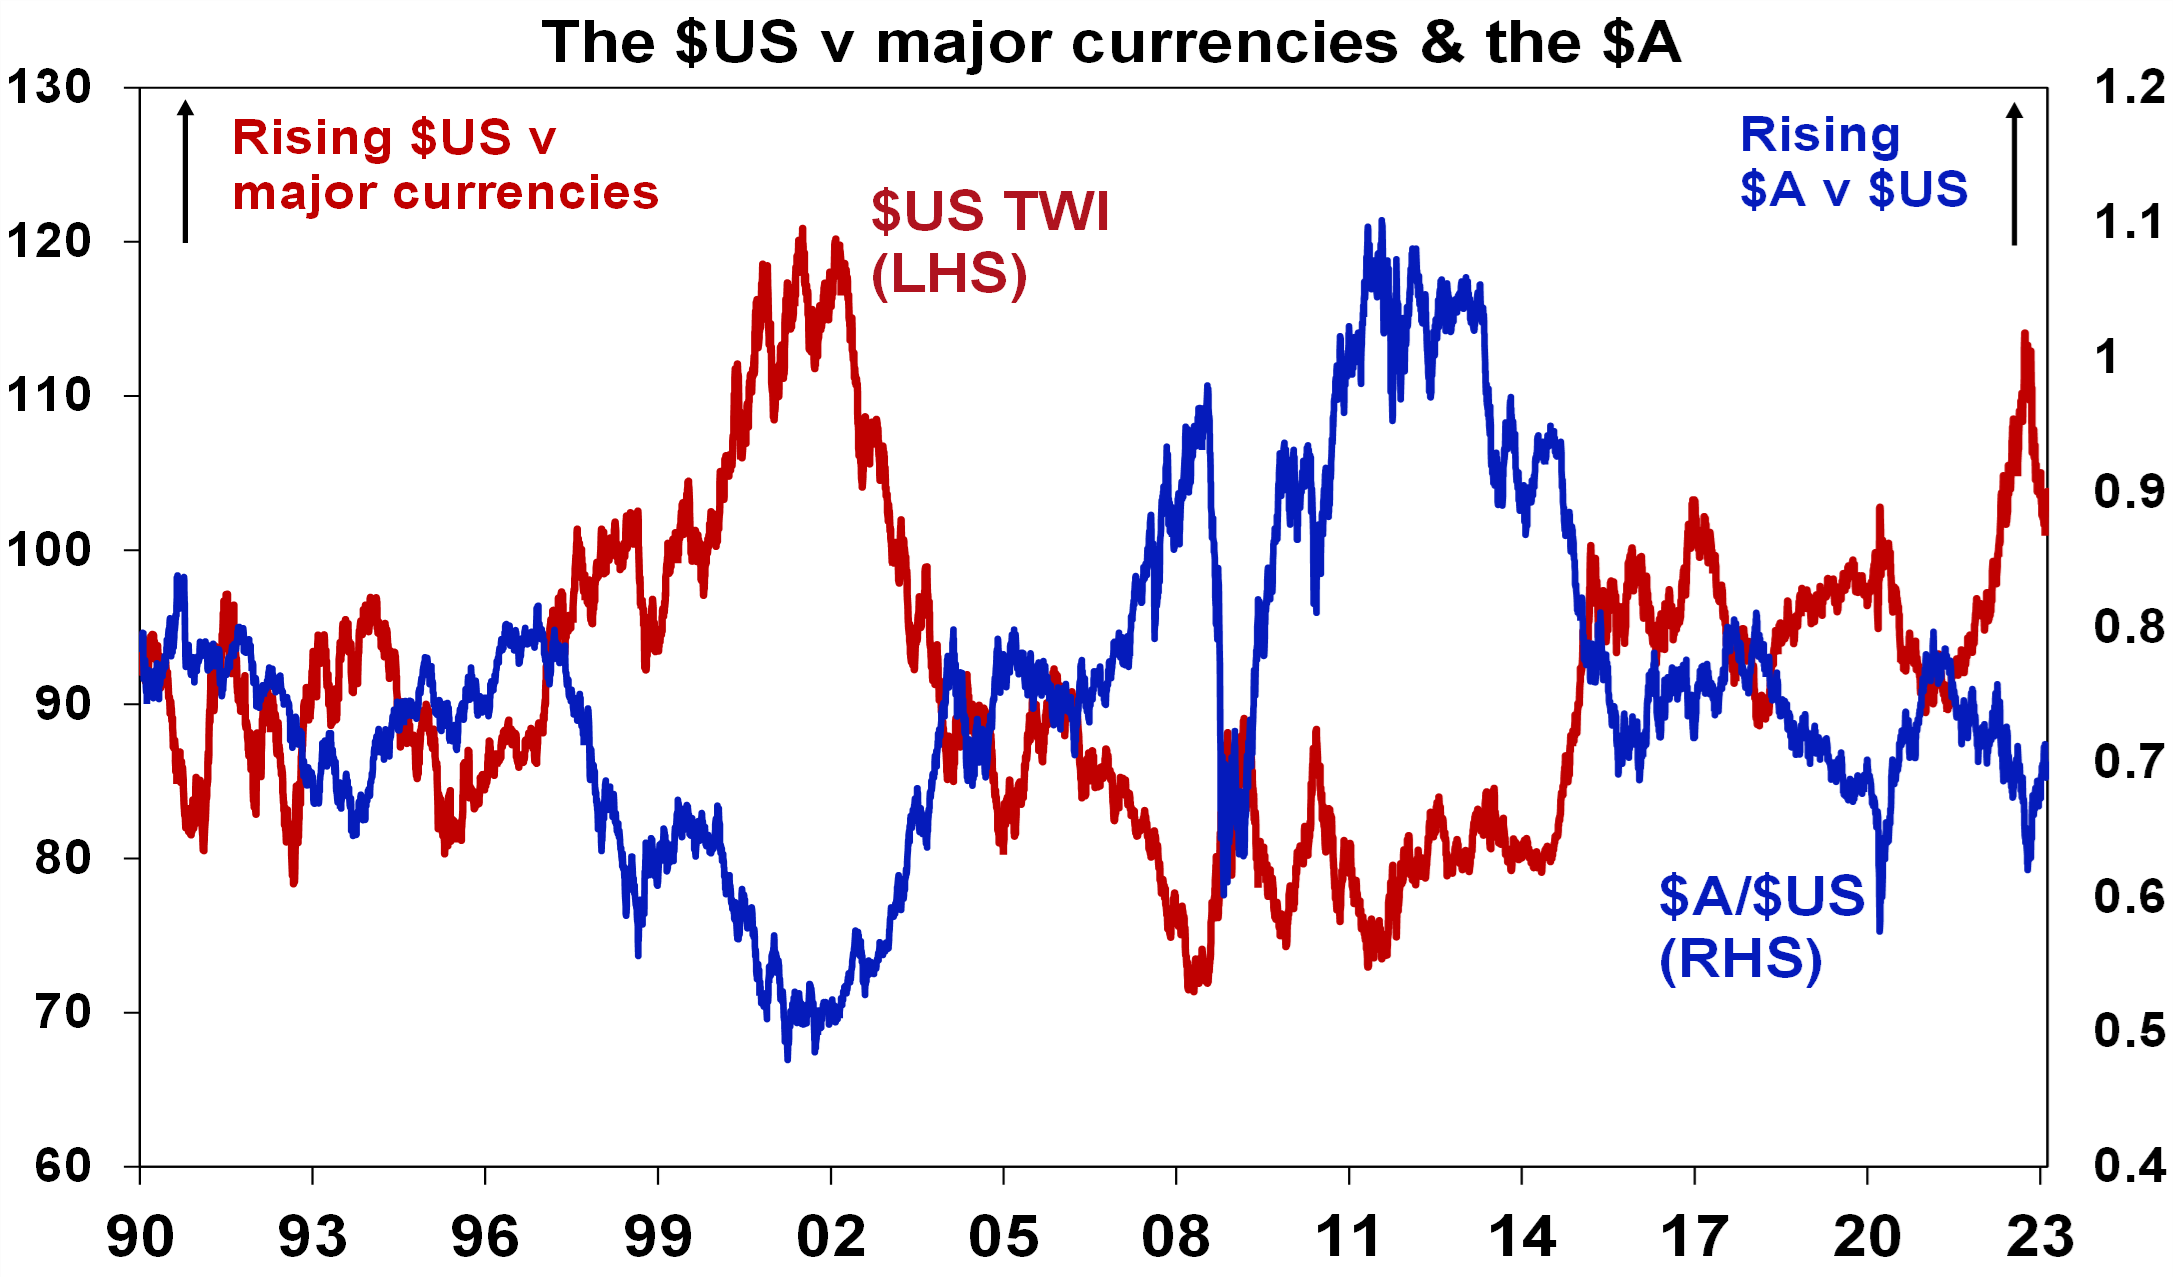
Source: Bloomberg, AMP
Norway wealth fund posts record $164 billion loss
By Victoria Klesty
Norway wealth fund CEO Nicolai Tangen presented the results for 2022, at a news conference in Oslo, Norway January 31, 2023. NTB/Heiko Junge via REUTERS- Summary
- Companies
- Loss in 2022 exceeds previous record from 2008
- Inflation, geopolitical tensions remain risk factors
- Record inflow of money from oil and gas industry
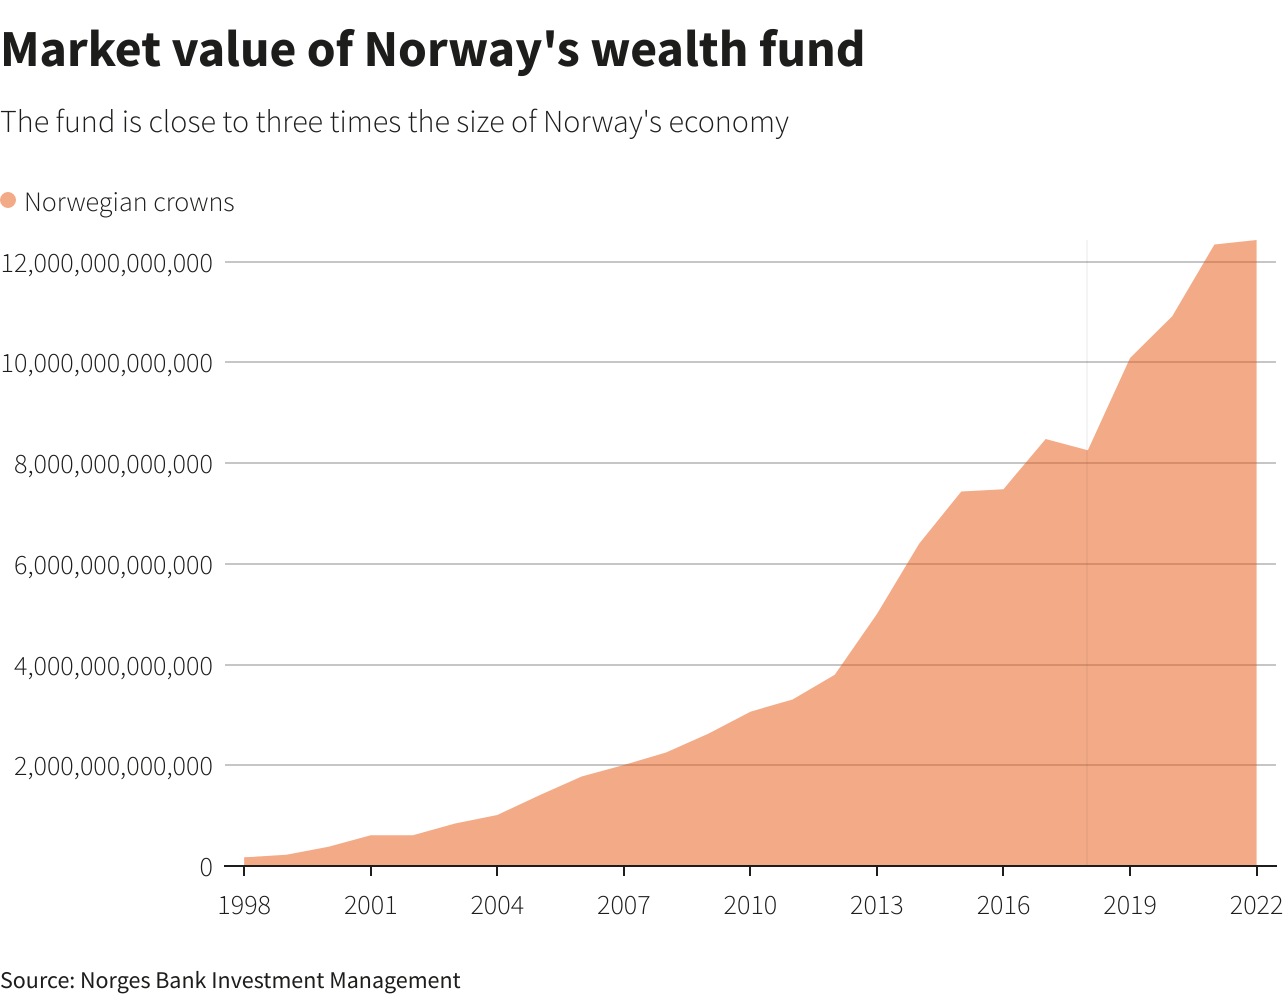
OSLO, Jan 31 (Reuters) – Norway’s wealth fund, one of the world’s largest investors, posted a record loss of 1.64 trillion crowns ($164.4 billion) for 2022, bringing to an end a three-year run of soaring profits as stocks and bonds were hit by the Ukraine war and inflation.
The previous largest loss was 633 billion crowns in 2008.
It ends a record-breaking streak for the fund, where annual returns exceeded one trillion crowns in each of the three years from 2019 to 2021, amounting to more than four trillion crowns combined.
We are invested in 9,000 companies in 70 countries. There is just nowhere to hide,” fund Chief Executive Nicolai Tangen told a news conference.
The single biggest stock market loss came from the fund’s stake in Amazon (AMZN.O), which declined in value by 56 billion crowns, followed by a loss in shares of Facebook owner Meta Platforms (META.O) of 52 billion and in Tesla (TSLA.O) with 47 billion.
Still, despite the record loss, the value of the fund rose overall by 89 billion crowns or $8.9 billion year-on-year, partly due to the weak Norwegian currency and a record 1.1 trillion crowns of cash inflows.
The inflows in 2022 were nearly three times the previous record, of 386 billion crowns, set in 2008.
The fund invests the Norwegian state’s revenues from petroleum production. As a major crude exporter and Europe’s largest gas supplier after a drop in Russian gas flows, Norway benefited from high energy prices due to the war in Ukraine.
Gold majors report a mixed bag
Vidhya Sreelalan
Principal Research Analyst, Gold at Wood Mackenzie
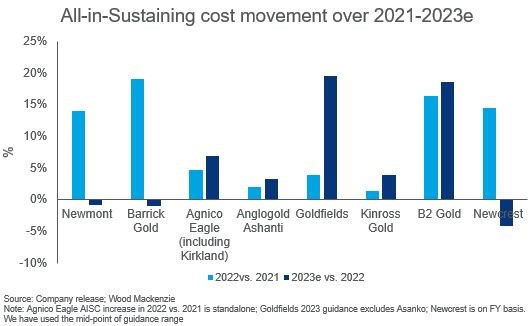
Gold majors report a mixed bag when it comes to annual cost inflation and guidance for 2023 2022 was a tough year for gold miners, with rising costs due to higher fuel, energy, consumables and labour prices, creating challenging operating conditions.
Costs have started showing initial signs of stabilisation, however, they remain elevated as global supply chains and labour markets continue to be constrained. At Wood Mackenzie, we expect a drop in power, diesel and gas prices in 2023 compared to 2022 and at the start of this year, we estimated that the gold industry’s cost base could fall year-on-year in 2023. All be it slowly, given the expectation of a rocket and feather effect to play out in the industry and any decline to be gradual.
The latest set of results from leading gold miners points to much conservatism within the industry. In hindsight, 2022 looks unsurprising (and painful), but it is the 2023 cost guidance that highlights how cautious miners are being with their stance on inflation. 2022 saw multiple upward revisions in cost guidance and companies still missing the revised guidance come year-end. That explains most of the caution baked into the latest AISC guidance. A beat on conservatism is psychologically still better than a miss on optimism!
I hope you have enjoyed this week’s read. I have attached the most recent Market announcements in case you missed the alerts. If you wish to discuss the Reports, please feel free to give us a call.
Regards,
Chris Hagan.
Head, Fixed Interest and Superannuation
JMP Securities
Level 1, Harbourside West, Stanley Esplanade
Port Moresby, Papua New Guinea
Mobile (PNG):+675 72319913
Mobile (Int): +61 414529814