At JMP Securities, we love the work and the people at the Bank of Papua New Guinea.
The Bank’s team puts out timely and reliable statistics that are invaluable to investors and market participants, as well as economists and policy makers of course.
However, un-surprisingly, their way of setting out their data and disseminating the information is often a little cumbersome and can be hard for investors to dissect.
As such, we will endeavor to give you a snapshot of the PNG public debt picture in a format that you will all be familiar with.
Although we have summarized the information already available to us, there is still a lot of additional data that would be useful and valuable to fixed interest traders as well as macro-economic forecasters.
If you are in possession of data, research or information that you can appropriately share with others, we would love to hear from you and would be sure to incorporate this information in future research notes.
Whilst information is power (and value), we are firmly of the view that all market participants need to collaborate to improve the flow of data in the PNG marketplace for the foreseeable future.
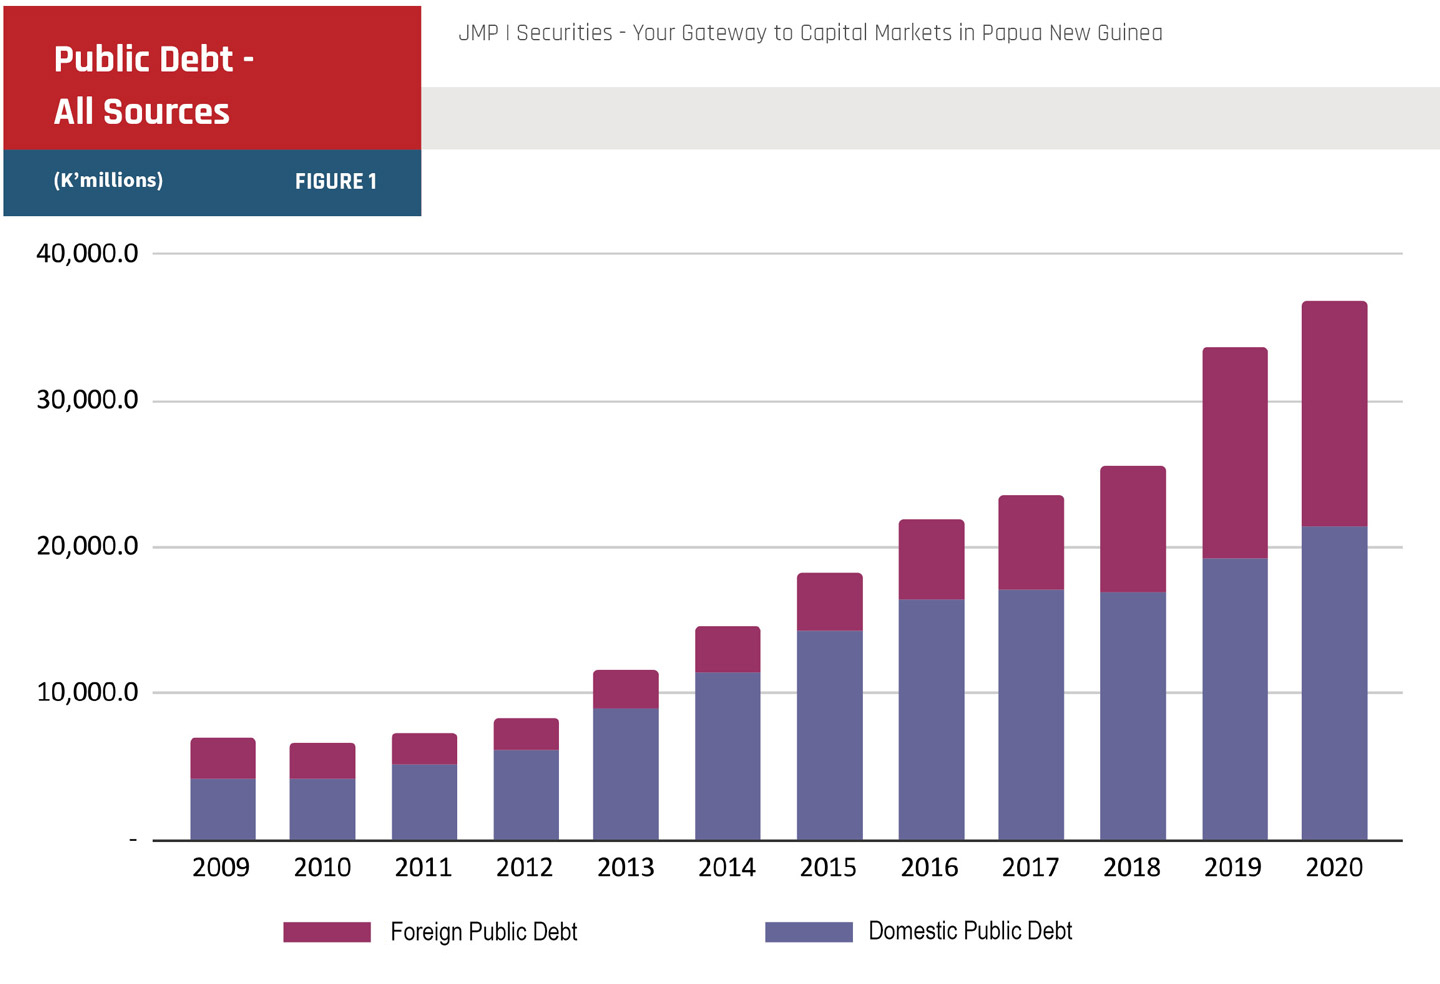
According to data from BPNG, the total Public Debt of the Government of the Independent State of Papua New Guinea as at 30 June 2020 was K36.87 bn.
Of this, K21.36 bn or 57.9% of this was owed to lenders of domestic securities and facilities and K15.52 bn or 42.1% was owed to foreign lenders.
As is evident from the graph above (Figure 1), the aggregate indebtedness of the Government has grown considerably in recent years and the trend appears to continuing at an accelerated pace.
Both foreign and local currency debt has been growing at a fast pace in recent years. Between the end of 2010 and June 2020, overall debt has increased from K6.6bn to K36.9bn, representing an almost six-fold increase in less than 10 years.
It is important to note that the ability of a government to sustain increased debt levels is a function of the growth in the overall economy, as well as the general fiscal position.
The significant increase in debt has corresponded with a period of considerable economic growth and development for PNG (notwithstanding the difficulties in the last few years) and as such the consequences and risks associated with the increase need careful analysis and interpretation.
External Debt
Domestic Debt
As is evident from the table above
(Table 1) and accompanying chart below, (FIGURE 2) the preponderance of the State’s borrowings have been drawn from the domestic T-bill (up to 360 days) and Government Inscribed Stock (‘GIS’) programs as well as from international agencies and partners.
In recent years, International Commercial Loans and Other Loans from International sources have begun to be represented.
This corresponds with the inaugural US$500 million sovereign bonds issued in late 2018 as well as well publicized loans from Credit Suisse several years ago.
The much debated borrowings from the government of or financial institutions from the People’s Republic of China have been included in the ‘International
Agencies – I’ category.
‘Other Loans – D’ represent commercial loans from PNG based financial
institutions such as borrowings from BSP in respect of the Solwara 1 project and other borrowings.
Rise and fall since 2009
It is noteworthy that foreign public debt increased significantly during 2018 and 2019 but that this growth seems to have been curtailed somewhat during the first half of 2020.
Perhaps in consequence of the limitations placed on international dealings by the Covid-19 pandemic, the largest source of growth in public debt during the course of 2020 has been domestic.
This is consistent with the significant Covid-19 Bonds (GIS) issued by the State during the initial months of the pandemic in April-June 2020.
Crowding out private sector borrowers.
Foreign debt as a percentage of the overall debt burden of the Government reached its lowest level in recent years in 2014 (21.73%) and has almost doubled its share of the total debt portfolio since then.
Although this requires ongoing monitoring, vigilance and an active policy response on the part of the Treasury, given the limited pool of domestic capital available to the Government, diversifying its sources of capital to include a broader spectrum of international capital providers has most likely had a positive impact on the overall levels of interest rates.
Relying on domestic sources of debt capital has the potential to result in ‘crowding out’ of private sector
borrowers and thus impacting on growth and incomes in the wider economy.
However, foreign borrowings usually involve currency rate and liquidity risks which has the potential to increase the overall risks and costs associated with such borrowings.
Given that the vast preponderance of PNG’s foreign debt is with International Agencies, only a modest portion of borrowings involve pure market based risks.
The overall foreign debts of Papua New Guinea have increased in recent years through a combination of additional facilities and drawdowns, as well as adverse valuation impacts from movements in exchange rates.
Consistent with expectations, the movements in foreign debt balances are amplified as the aggregate outstanding balances increase.
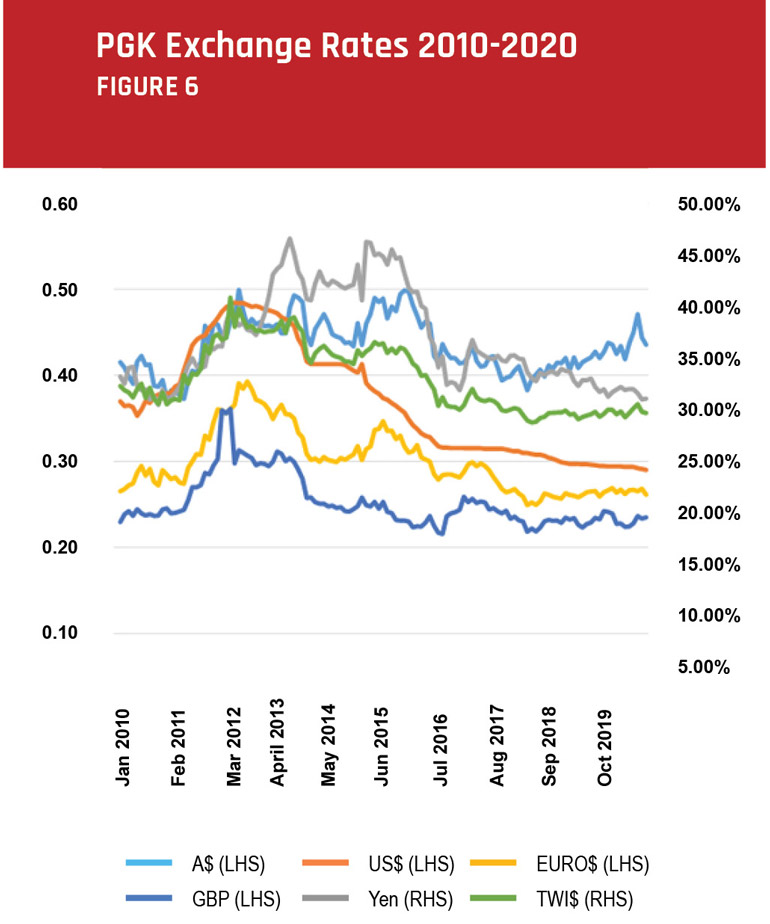
During the course of 2019, a significant deterioration in the rates of exchange between the PNG Kina and several major international currencies resulted in almost K3 bn in adverse, unrealized exchange losses on the State’s outstanding foreign debts.
Given the turmoil in the first half of 2020 as a result of the
Covid-19 pandemic and the resulting dislocation in global foreign exchange markets, this was not repeated during that period.
During the initial stages of the pandemic, the PGK maintained its value against the US$ and actually increased slightly in value against a number of other currencies.
Notwithstanding the impact of the pandemic, during the first half of 2020, the State drew down more than K1.85 bn in fresh foreign loans.
Repayments of foreign debt principals have also increased in recent years, with K676 million being repaid in the first half of 2020 alone, compared with K737 million in all of 2019 and “only” K329 million in 2018.
JMP Knowledge Lab is working on creating a detailed maturity profile in respect of both domestic and foreign debts and we hope to share this with our clients in the near future.
It should shed significant light on the liquidity position associated with the current borrowings and consequently the likely re-finance risks.
Treasury Bills and Government inscribed stock make up 55% of total borrowings.
Over the 10 years from the end of 2010 through to June 2020, the total stock of outstanding T-bills increased from K1.56 bn to more than K10.8 bn. This is almost a 7-fold increase.
Treasury bills are a very flexible instrument and are widely understood and transacted in the local market. Given their short tenor, these instruments attract lower rates than GIS and can be issued by the State (through BPNG as its agent) at short notice.
GIS are local currency denominated bonds and are issued at regular intervals. At present, foreign buyers are almost non-existent in both the T-bill and GIS markets.
Almost all trading in T-bills and GIS are done on the primary auction and related TAP markets.
Although traditionally there has been virtually no secondary market in PNG for T-bills and GIS, one is rapidly emerging on an Over The Counter basis. JMP Securities now regularly cross multi-million kina positions in the secondary market.
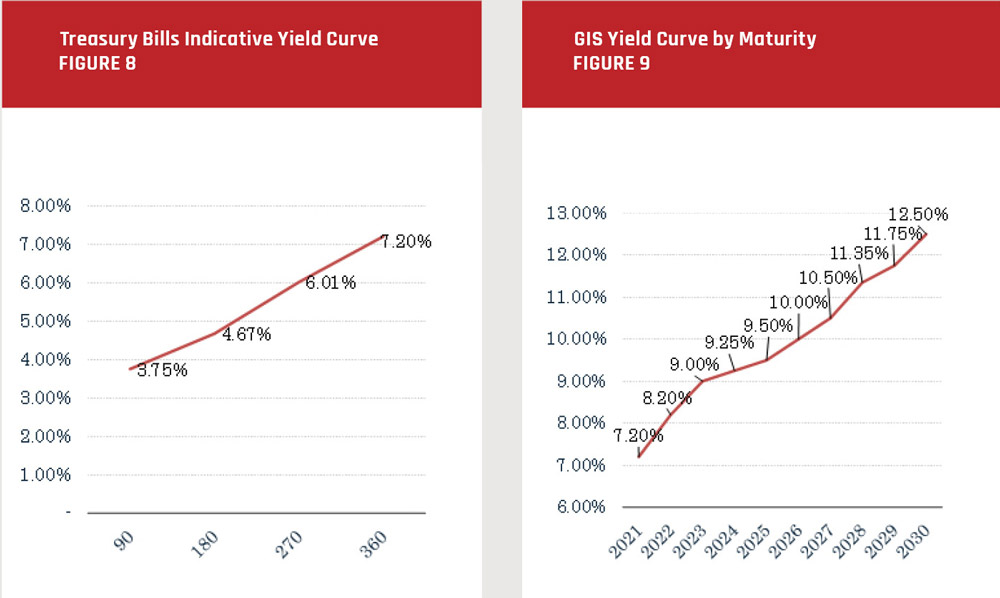
In terms of indicative yield curves, the absence of a liquid secondary markets acts an impediment to ascertaining the yield to maturity of each tenor of security on an ongoing basis. However, the charts below are illustrative of current market yields
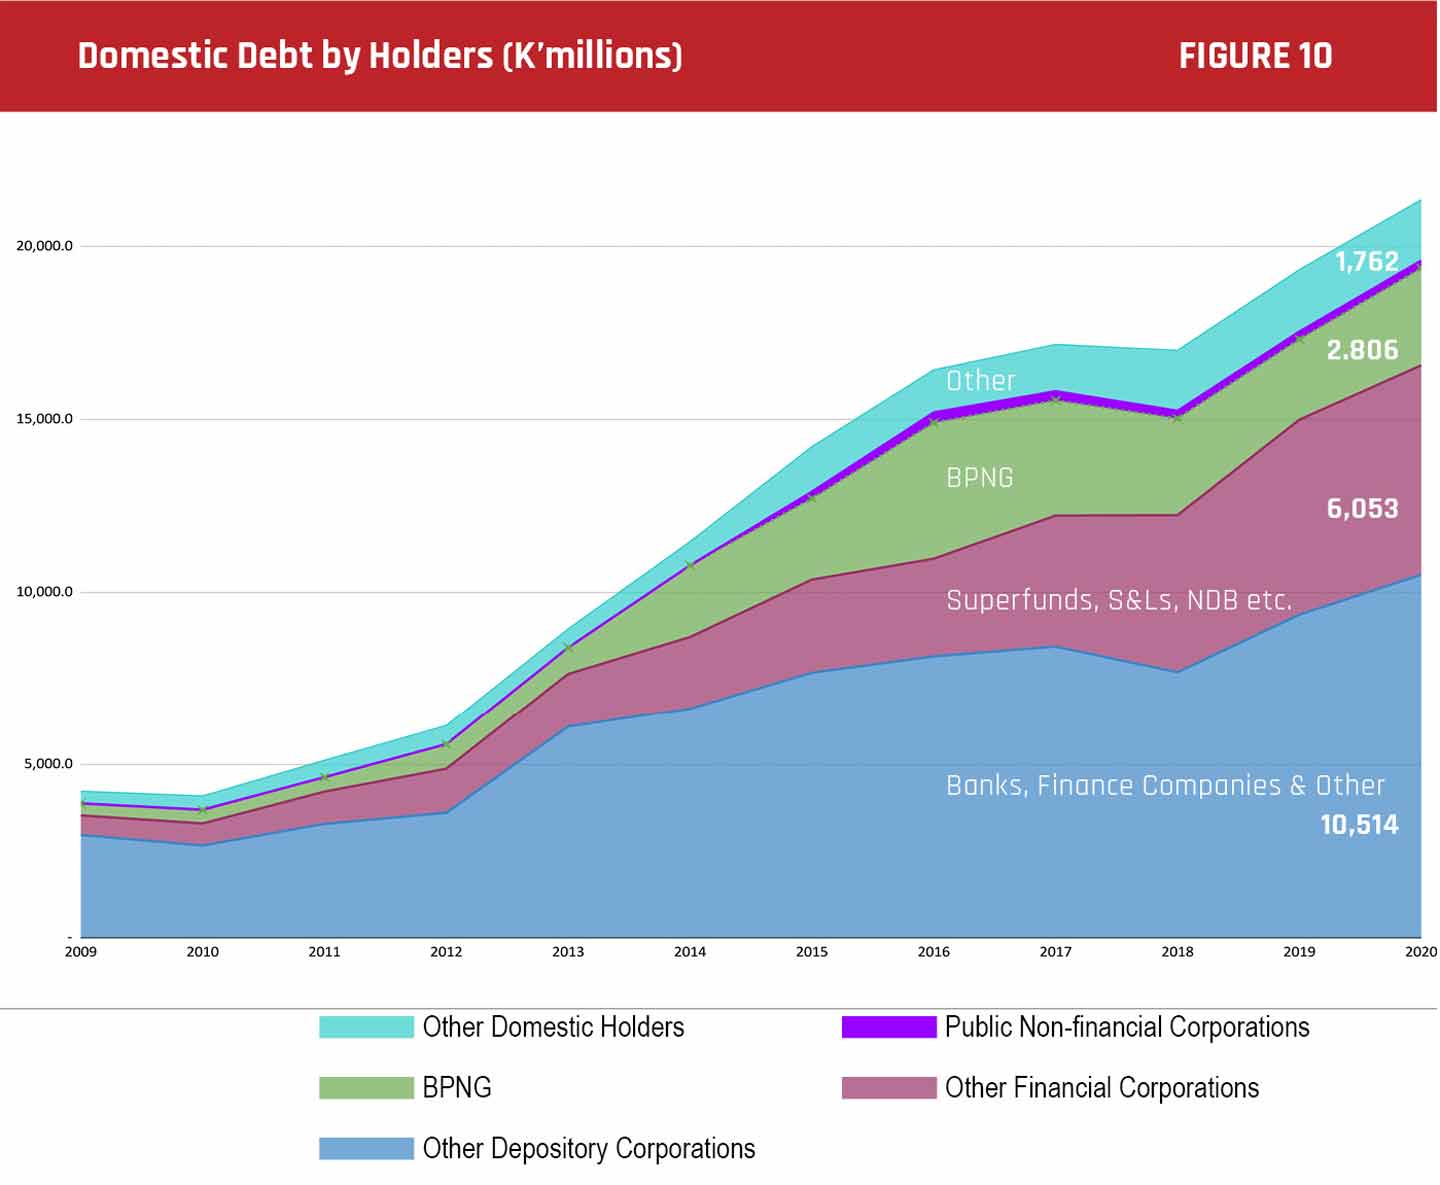
Almost 50% of all domestic debt is owed by the State to Banks and other deposit taking financial institutions.
Banks are major holders of Treasury Bills on account of the flexibility that the short term tenor of these instruments provide them. Managing a bank’s balance sheet and liquidity is a dynamic exercise and whilst being “near cash” assets, T-bills offer very competitive yields.
Banks have traditionally been more reluctant to take large positions in the GIS market. This is consistent with the need for flexibility, as well as the need to avoid a mismatch between a bank’s liabilities (deposits) and its assets – loans and debt securities.
Superannuation funds are major holders of GIS with much smaller positions in Treasury Bills. Again, this is consistent with the desire of superannuation funds to provide contributors with stable, long term income and cash flows.
BPNG is also an active participant in the T-bills and GIS markets. This is in addition to BPNG’s role as an issuer of Central Bank Bills of which the Banks are major holders. CBB’s typically trade at lower yields to comparative Treasury Bills.
From the table above, it is clear that BPNG began its active participation as a lender to the State in 2014. In that year, BPNG’s net position increased by more than K1.2 bn compared to 2013.
It is also noteworthy that the BPNG exposure to the State increased by K500m during the first half of 2020. This is consistent with active support for the Covid-19 bond program by the Central Bank as well as other measures aimed at ensuring liquidity to the State during this challenging period.
The table below further illustrates the contributions by groups of lenders to the overall State domestic borrowings.
ODC are banks and finance companies etc, whereas OFC are mainly superannuation funds, life insurers, general insurers and some other financial corporations:
Please fill out the form and press the submit button.
For the latest market news and alerts.
The story of the last decade seems to be the forceful emergence of the superannuation funds as an increasingly large lender to the State.
Banks have reduced their share and BPNG seems to have increased its participation, albeit spasmodically.
The implications of the above analysis for businesses, policy makers an investors are multifaceted and complex.
In a subsequent note, JMP Knowledge Lab will examine in more fulsome detail what it means for the economy and your investment strategies.
At this stage, suffice it to say that public borrowings can be a catalyst for positive developments.
It allows the State to smooth out volatile cash flows, provide economic stimulus at times when it is needed – such as during a global pandemic – and it plays an important role in delivering public investments which have the potential to drive welfare outcomes for our people as well as enhancing the productive capacity of the PNG economy.
The trick…..as they say…..is to make sure not to overdo it!
So far, there are probably no screaming alarm bells ringing, however finding that path back to a balanced budget is important in the medium term.
The global bond markets seem to agree with us, with yields on PNG’s inaugural sovereign bond which matures in 2028 not exhibiting signs of market disquiet at this stage.
But we do know that financial markets, global or local, can shift their sentiments quickly.
And the more drawn down we are, the less room there is for error or to move if circumstances were to change.
Even locally and in local currency, we must be mindful that the pool of capital available for us to draw from is limited.
To add to this, we must never forget that you can only borrow money for as long as someone is willing to lend to you.
In global markets, the pool of funds is practically limitless, but the segment that has appetite for our type of credit is much more limited.
As noted above, we must also be careful not to binge on foreign currency debt since it introduces additional risks into our refinancing profile.
Take the banking industry for example. We saw earlier that the commercial deposit taking institutions make up a significant share of lenders in the T-bill/GIS space. Let us examine this in a bit more detail.

The chart to the right illustrates the numbers in a way that we all probably find more intuitive.
You will note that T-bills and GIS already account for close to K9 bn out of a total of K30.8 bn in the banking system or close to 30%.
Add to this, Loans to customers of K13.45 bn or 43.7% and we have already accounted for more than 73% of the banking sector’s balance sheets.
If we want to keep borrowing from the banks (absent injection of funds into the sector from domestic or overseas sources or quantitative easing to expand balance sheets), the banking industry can only lend to the State (T-bills, GIS or loans) by moving money around on its balance sheet.
The banks can lend more to the State by lending less to business and individuals.
To investigate sources of additional banking support for T-bills and GIS for example, we would need to investigate the ‘Deposits’, ‘Foreign Assets’ and ‘Other Assets’ categories. involves.
The analysis can be replicated across a number of categories of lenders, for example Superannuation Funds.
These are not insurmountable challenges and the Government of Papua New Guinea still has time to meet them.
However, we should all encourage our leaders to ensure that funds obtained through borrowings – whenever they are incurred – are deployed in productive manners.
If the economy grows, the size of the pie grows, as does the balance sheets of institutional investors, businesses and individuals and families.
This in turn results in additional capital for further growth and development.
A virtuous cycle indeed!