3 October, 2024
Welcome to this week’s JMP Report,
The end of the school holidays allow for a renewed (albeit slightly delayed) return of the JMP Weekly Report. As always, lots to discuss and a number of interesting developments.
There was modest trading on PNGX during the week ended 27 September 2024:
WEEKLY MARKET REPORT | 23 September August, 2024 – 27 September, 2024
| STOCK | WEEKLY VOLUME |
CLOSING PRICE | VALUE | BID | OFFER | CHANGE | % CHANGE |
| BSP | 1,824 | 18.08 | 32,978 |
18.08 | – | 0.06 | 0.33% |
| KSL | 284,952 | 3.10 | 883,351 | 3.10 | 3.15 | 0.05 | 1.64% |
| STO | 1,255 | 19.45 | 24,410 | 19.45 | – | – | – |
| NEM | – | 150.00 | – | 148.00 | – | – | – |
| KAM | 1,000 | 1.40 | 1,400 | 1.30 | – | 0.10 | 7.69% |
| NGP | 2,905 | 0.75 | 2,179 | – | – | – | – |
| CCP | 1,625 | 2.51 | 4,079 | 2.51 | – | – | – |
| CPL | 14,135 | 0.69 | 9,753 | – | 0.69 | 0.01 | 0.40% |
| SST | 490 | 50.00 | 24,500 | – | 50.00 | (0.10) | (12.66%) |
| TOTAL | 2,890,875 |
WEEKLY YIELD CHART | 23 September August, 2024 – 27 September, 2024
| STOCK | NUMBER ISSUED OF SHARES |
MARKET CAP |
2023 INTERIM DIV | 2023 FINAL DIV | 2024 FINAL DIV | YIELD % LTM |
| BSP | 467,219,979 | 8,447,337,220 | K0.37 | K1.06 | K0.45 | 8.35% |
| KSL | 287,432,858 | 891,041,860 | K0.10 | K0.16 | K0.106 | 8.58% |
| STO | 3,247,772,961 | 63,169,184,091 | K0.31 | K0.66 | k0.506 | 5.99% |
| NEM* | – | – | – | – | – | – |
| KAM | 50,693,986 | 70,971,580 | K0.12 | – | K0.20 | 14.29% |
| NGP | 45,890,700 | 34,418,025 | K0.03 | – | K0.04 | 5.33% |
| CCP | 307,931,332 | 772,907,643 | K0.11 | K0.13 | K0.12 | 9.96% |
| CPL | 206,277,911 | 142,331,759 | K0.05 | – | – | – |
| SST | 31,008,237 | 1,550,411,850 | K0.35 | K0.60 | K0.40 | 2.00% |
| TOTAL | 75,078,604,029 |
a LTM = Last Twelve Months. We have calculated yields based on most recently declared interim and final dividends.
* NEM pays quarterly dividends. We have added last 4 payments at current FX rates.
NEM has been exluded from Market-wide yield calcs.
A couple of noteworthy items from the last couple of weeks:
- KAM announced a cracker of a dividend on 19 September 2024, being K0.20 per share taking the Last-Twelve-Months (LTM) dividend yield to a market leading 14.29%.
It is great to see strong performance by KAM in recent quarters and even more encouraging that this is reflected in the dividend payments to shareholders.
We should caution against shareholders thinking that dividends at these levels will be sustainable every year, however KAM has done a great job in positioning its portfolio thus far in 2024.
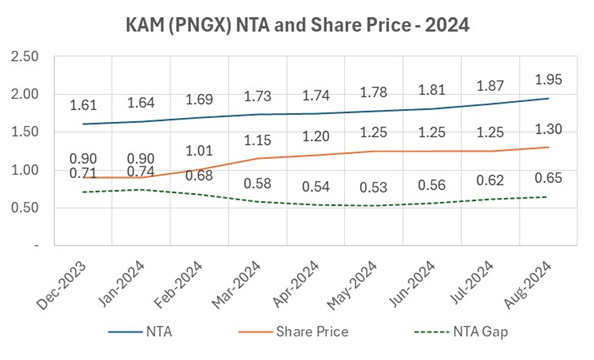
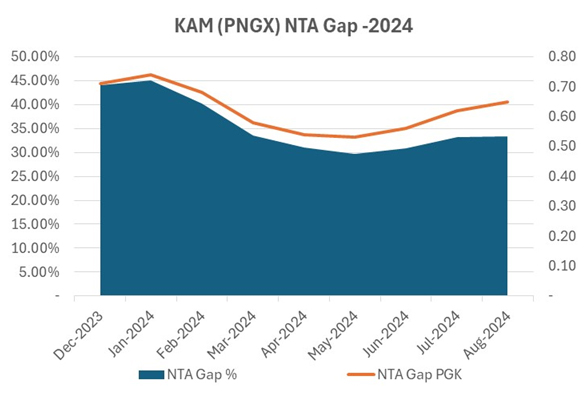
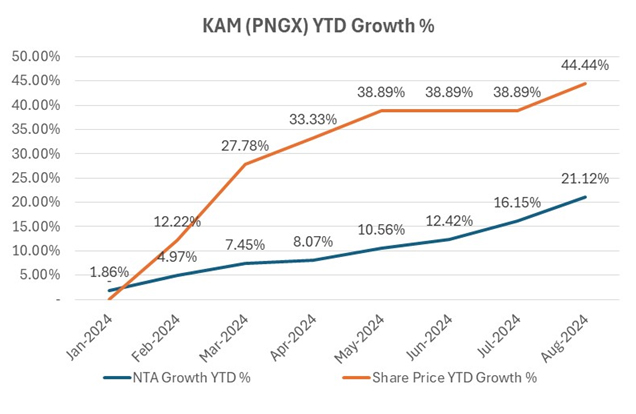
YTD 31 August 2024, KAM’s stock price had increased by 44.44%, whereas the NTA per share had increased by 21.12% over the same period. As of 30 September 2024, the share price had increased by a further K0.10, taking the full YTD share price increase to K0.50 or 55.56%. The 30 September 2024 NTA figures will only be released in the next week or so:
| DATE | NTA |
NTA GROWTH PGK | NTA GROWTH YTD PGK | NTA GROWTH YTD % | SHARE PRICE | SHARE PRICE GROWTH PGK | SHARE PRICE GROWTH YTD % | SHARE PRICE GROWTH YTD % | NTA GAP PGK | NTA GAP % |
| DEC-23 | 1.61 | 0.90 | 0.71 | 44.10% | ||||||
| JAN-24 | 1.64 | 0.03 | 0.03 | 1.86 | 0.90 | – | – | – | 0.74 | 45.12% |
| FEB-24 | 1.69 | 0.05 | 0.08 | 4.97 | 1.01 | 0.11 | 0.11 | 12.22% | 0.68 | 40.24% |
| MAR-24 | 1.73 | 0.04 | 0.12 | 7.45 | 1.15 | 0.14 | 0.25 | 27.78% | 0.58 | 33.53% |
| APR-24 | 1.74 | 0.01 | 0.13 | 8.07 | 1.20 | 0.05 | 0.30 | 33.33% | 0.54 | 31.03% |
| MAY-24 | 1.78 | 0.04 | 0.17 | 10.56 | 1.25 | 0.05 | 0.35 | 38.89% | 0.52 | 29.78% |
| JUNE-24 | 1.81 | 0.03 | 0.20 | 12.42 | 1.25 | – | 0.35 | 38.89% | 0.56 | 30.94% |
| JULY-24 | 1.87 | 0.06 | 0.26 | 16.15 | 1.25 | – | 0.35 | 38.89% | 0.62 | 33.16% |
| AUGUST-24 | 1.95 | 0.08 | 0.34 | 21.12 | 1.30 | 0.05 | 0.40 | 44.44% | 0.65 | 33.33% |
2. Another week, another record share price close for BSP. This time the stock closed at K18.08, up K0.06 or 0.33%. Volumes were very modest at only 1,824 shares traded for K32,978 in total turnover.
However a record is still a record.
3. All of the active listings except NEM traded during the week ended 27 September 2024. This is highly unusual and a really positive sign in the market. Although aggregate traded value was only K982,600, it was very pleasing to see price discovery for almost all of the shares on PNGX during the same week. Upwards and onwards we say!;
4. NGP (NGIP Agmark Limited) produced a cracker of a set of financials for the six months to 30 June 2024. Revenue was up 142% to K188.6 million compared to the previous corresponding period, driven mainly by the significant increase in global cocoa prices. Profit After Tax was up 367% to K8.8 million for the half year period. The dividend was increased from K0.03 to K0.04 per share;
5. CCP has consolidated its position above K2.50 per share with further modest volumes changing hands at K2.51 during the week;
6. The market has finally recorded a trade in CPL, with 14,135 shares changing hands at K0.69 during the week. This represents a drop of K0.10 since the last traded price, however when we consider that this is the first trade in the stock since the January riots which so heavily impacted on the company, we consider this to be a good outcome for shareholders and for the company. As the recovery for CPL continues, we hope for improved news-flow and a further return to the market of buyers for the stock; and
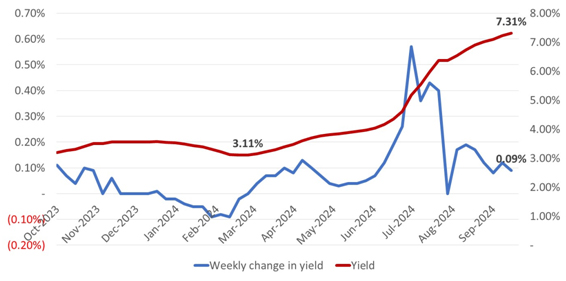
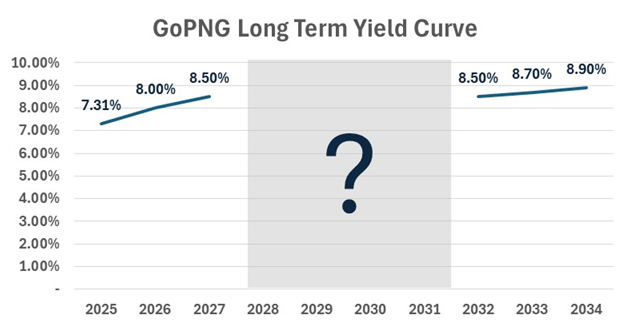
7. Last week was another busy week in fixed interest markets, with the 364-day Treasury Bill yields jumping another 0.09% to 7.31% – cementing the yield above the psychologically important 7.20% level which was held for a long period in the lead up to the drop that occurred in late 2021.
| AUCTION | MATURITY (YEARS) |
AMOUNT ON OFFER K’ MILLION |
BIDS RECEIVED K’ MILLION |
SUCCESSFUL BIDS K’MILLION |
SHORTFALL K’ MILLIONS |
FILL RATE % |
YIELD % |
| ISSUE 1D 2024/3384 | 2 | 70.00 | 80.00 | 70.00 | – | 100.00% | 100.00% |
| ISSUE 1D 2024/3385 | 3 | 70.00 | 40.00 | 30.00 | 40.00 | 42.86% | 100.00% |
| – | 4 | – | – | – | – | – | – |
| ISSUE 1D 2024/3386 | 5 | 100.00 | 10.00 | – | 100.00 | – | – |
| ISSUE 1D 2024/3387 | 6 | 100.00 | 10.00 | – | 100.00 | – | – |
| ISSUE 1D 2024/3397 | 7 | 100.00 | 10.00 | – | 100.00 | – | – |
| ISSUE 1D 2024/3398 | 8 | 100.00 | 20.00 | 10.00 | 90.00 | 10.00% | 8.50% |
| ISSUE 1D 2024/3399 | 9 | 130.00 | 22.50 | 12.50 | 117.50 | 9.62% | 8.70% |
| ISSUE 1D 2024/3400 | 10 | 130.00 | 12.50 | 12.50 | 117.50 | 9.62% | 8.90% |
| TOTAL | 800.00 | 205.00 | 135.00 | 665.00 | 16.88% |
The low volumes of bids received and even lower levels of bids accepted outside of the 2- and 3-years series, means that we arguably still don’t have meaningful price (or yield) discovery across the 10-year curve.
Such as it is, the PNG 10-year yield curve is a strange looking beast, with NIL premium applied between the 3-year and the 8-year series.
We suspect this will change with the next lot of auctions in the coming weeks and months. The macro-economic interpretation of the yield curve as it currently stands is a mystery to most of us we suspect:
What we have been reading
Shares around record highs as inflation slides – but what are the risks? – Olivers Insights AMP

Dr. Shane Oliver | CHead of Investment Strategy and Economics and Chief Economist, AMP Investments
Key points
– Recession risks, the escalating Israel conflict, the US election along with still stretched valuations mean a high risk of another share market correction and continued volatility.
– The expansion of the war around Israel and Iran attacking Israel with more missiles is very concerning but unless oil supplies are disrupted the impact on global growth and shares will remain limited.
– However, the combination of global rate cuts, still okay global economic growth and Chinese stimulus are very positive for shares on a six-to-12-month horizon.
– While the RBA remains relatively hawkish, the resumption of falling underlying inflation since May tells us that the start of rate cuts here is getting closer.
Introduction
August and September are often weak months but despite a few wobbles US, global and Australian shares rose to record highs. And consistent with the “risk on” sentiment metal prices, gold and the $A are up and the $US has fallen. The key drivers have been central banks cutting rates as inflation falls, still reasonable global growth and news of aggressive stimulus in China. But what are the risks and why is the RBA lagging on rates?
Central banks are winning the battle against inflation
Success in getting inflation down is the main driver of market cheer. Its surge depressed markets in 2022 (as higher inflation means higher interest rates and lower price to earnings multiples) and its decline has enabled them to rebound. In major developed countries it peaked around 8-11% in 2022 and has now fallen to around 2-3%.
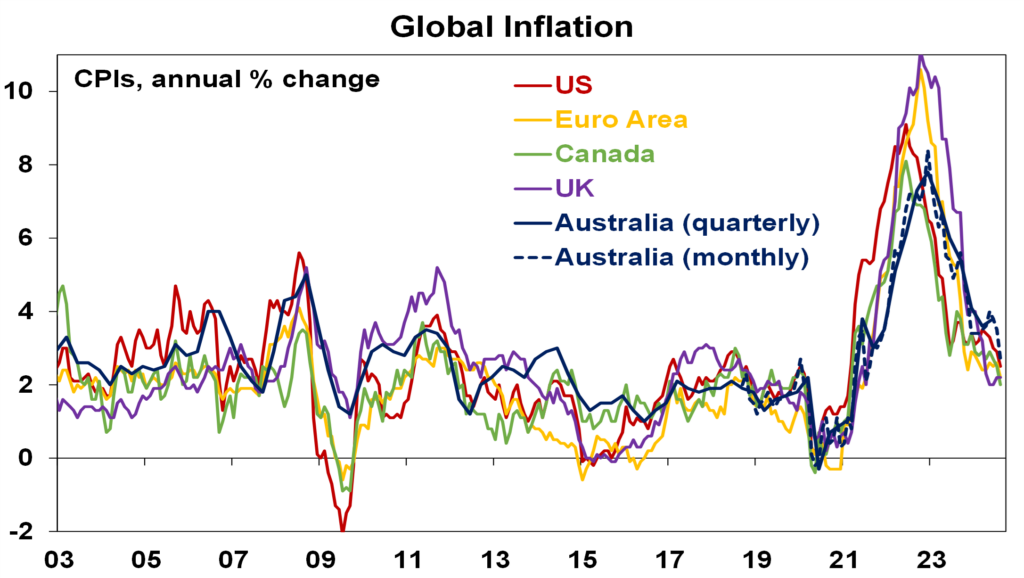
Source: Bloomberg, AMP
This is enabling central banks to cut interest rates
The rise in inflation in 2021-22 was a classic case of too much money or demand (on the back of pandemic stimulus and then reopening) chasing too few goods and services (as supply was constrained). Its reversal reflects the reversal of fiscal stimulus, improved supply chains and monetary policy going from easy to tight. In particular, the aggressive monetary tightening helped slow demand and, by signalling that central banks were serious about getting inflation back to target, helped keep inflation expectations down. This in turn has made it easier to get inflation back down.
With inflation heading back to targets, central banks have been able to start cutting interest rates with nearly 50% of global central banks, including the Fed, now cutting. Money markets are expecting further easing ahead.
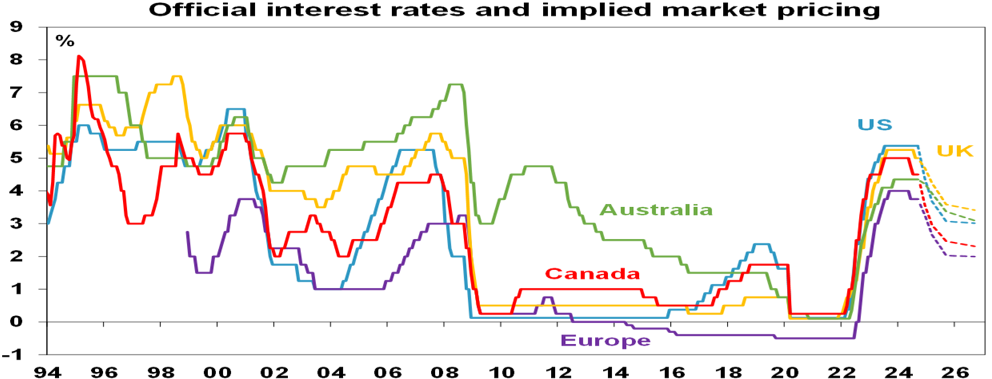 Source: Bloomberg, AMP
The good news has been that central banks have been able to get inflation back down without causing a collapse in global growth or sharply higher unemployment in contrast to the experience of the 1970s, 80s and 90s. Of course, conditions vary – with the US still strong and Europe weak – but global growth still looks on track to be around 3% this year.
This has also come at a time when the Chinese government has announced a big step up in policy stimulus. This included substantial monetary easing and a commitment to increased counter cyclical fiscal policies, “necessary” levels of fiscal spending and measures to stop the property decline.
So, shares celebrated. Apart from still stretched valuations, there are four key issues. Is recession still a risk? What about geopolitical threats including the Middle East? Will China stimulus work? And what about the RBA?
(Note: The US port strike is also a risk, but I doubt it will have a lasting impact – remember similar worries about Red Sea shipping disruptions and the Baltimore bridge collapse.)
What is the risk of a US recession?
Falling interest rates are positive for shares as they help boost economic and profit growth and make shares relatively more attractive than cash. So, the first rate cut after a hike tends to be positive for shares. Unless there is a recession! The table below shows the US share market’s response after the first rate cut since 1981. The US share market rose over the subsequent 3, 6 and 12 months after the commencement of 6 of the last 9 Fed easing cycles. The exceptions were after the rate cuts in 1981, 2001 and 2007 which were associated with recessions and the period after the first 2019 cut saw a “recession” and brief plunge in shares due to the pandemic. The reaction by the Australian shares to US rate cuts is similar.
US equity performance (S&P 500), % change, after first Fed cut
| First rate cut | +3mths | +6mths | +12mths |
| July 81 | -6.9 | -8.0 | -18.2 |
| Sept 84 | 0.7 | 8.8 | 9.6 |
| Nov 87 | 1.3 | 4.6 | 11.0 |
| June 89 | 9.8 | 11.1 | 12.6 |
| July 95 | 3.5 | 13.2 | 13.9 |
| Sep 98 | 20.9 | 26.5 | 26.1 |
| Jan 01 | -8.5 | -11.3 | -17.3 |
| Sept 07 | -4.3 | -12.4 | -20.6 |
| July 19 | 1.9 | 8.2 | 9.8 |
| Average | 2.0 | 4.5 | 3.0 |
US recession highlighted in red. Source: Thomson Reuters, AMP
And as can be seen in the next chart, recessions often start after the first Fed rate cut – so a cut doesn’t necessarily mean recession will be avoided.
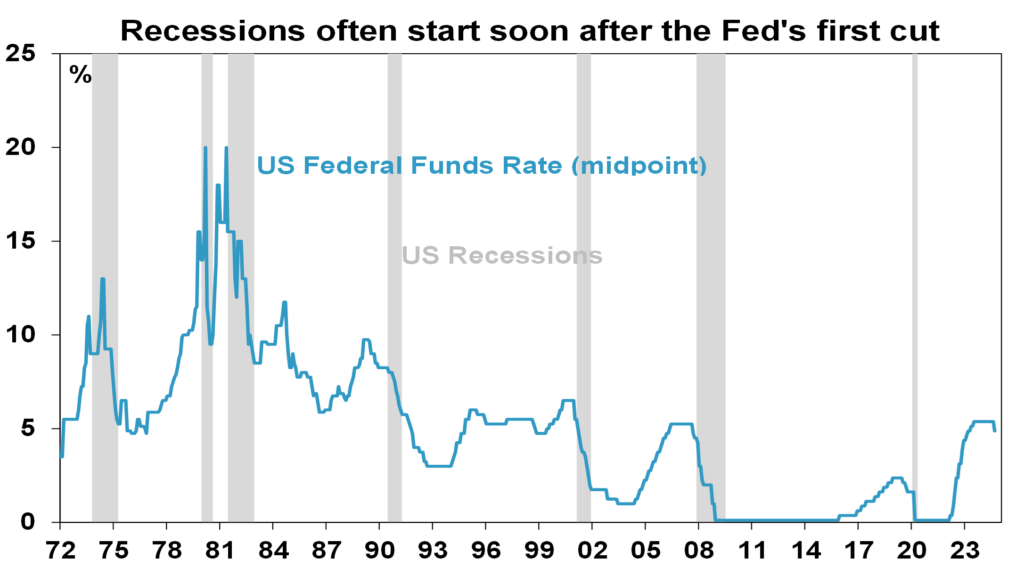
Source: Bloomberg, AMP
Our base case is that the Fed has just headed off a recession and indications continue to show solid growth in the US. But a recession is a high risk with the US yield curve and leading indicators continuing to point to recession and US jobs leading indicators – for example, a sharp downtrend in job openings and quits – showing significant weakness. It’s a similar story in Australia – a traditional recession should be avoided but it’s a high risk.
Geopolitical threats – the Middle East and US election
There are two main geopolitical threats at present: the Middle East and the US election. While the expanding war around Israel to include Hezbollah is a big concern from a humanitarian perspective, the key from an investment perspective is whether global oil supplies are impacted. The risks on this front have increased with Iran (which accounts for 3% of global fuel supply) attacking Israel with more missiles – and oil prices bouncing 5% or so, but only taking them to week ago levels. It could just turn out to be another exchange of missiles between Iran and Israel as we saw in April. So, much will depend on Israel’s response – if its proportional and focussed on Iranian military facilities then the oil price and shares will quickly settle down again. This will be helped by Saudi Arabia raising production in December, Libyan oil production (1% of supply) resuming and rising non-OPEC production. If alternatively, Israel escalates with an attack on Iranian nuclear or oil facilities then we could be in for a much rougher ride in share markets as things escalate impacting oil supply.
Since Kamala Harris took over as the Democrat presidential candidate share markets have not been particularly focussed on the US election. However, this could change as the race remains close and Trump’s policies on tariffs, tax cuts and immigration risk a new trade war and higher inflation which would be bad for shares. Of course, Trump may moderate his policies, but this will not be known for a while.
Will China’s stimulus work?
China’s package of stimulus announcements over the last week show the Government is now serious about wanting to boost growth after a run of weak data. If the moves were limited to easy money then they may be less effective as the cost of money is already low and the key problem is a lack of demand for money. So fiscal stimulus is also needed and the Chinese authorities at last appear to recognise this with a surprise Politburo meeting committing to significant fiscal stimulus and measures to halt the property decline. Of course, the details are yet to be announced but this shift from cautious incremental stimulus towards “whatever it takes” is significant and very positive for cyclical assets like metal prices, Australian resources shares and the Chinese share market as we have seen in the last week. Whether it extends beyond providing a cyclical boost to growth to addressing China’s structural problems – which will require measures to clear the property overhang and permanently boost consumer spending – remains to be seen.
What about the RBA?
While other central banks have been easing, the RBA remains hawkish. This stems from a setback in falling inflation earlier this year. However, the key measures of underlying inflation have resumed falling. As can be seen in the next chart “trimmed mean” inflation (the RBA’s preferred measure of underlying inflation) is just following US core inflation down with a lag. So just as Australian inflation and the RBA followed global inflation and rates up with a lag in 2022 (due to a slower reopening from the pandemic) they now look to be following with a lag on the way down.
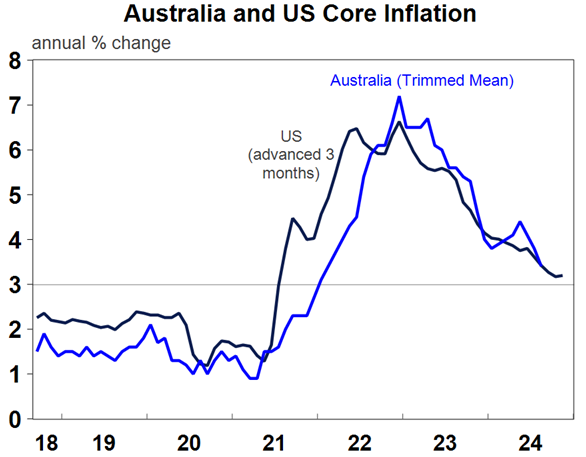
Source: Macrobond, AMP
The resumption of the downswing in underlying inflation provides confidence that rate cuts are getting closer. Our base case is that the RBA won’t cut until it’s seen lower underlying inflation in both the September and December quarters and so won’t start cutting until February next year. However, with inflation starting to follow a similar profile to that seen in the US, there is a high chance of a December cut if underlying inflation continues to fall as it has since May. The US experience with falling inflation despite still okay growth and low unemployment tells us the RBA’s concerns about excess demand in Australia may be overstated.
Concluding comments
Recession risks, the conflict in the Middle East, the US election along with still stretched valuations mean a high risk of another share market correction and continued bouts of volatility. However, the combination of global rate cuts, still okay global economic growth and Chinese stimulus are very positive for shares on a six-to-12-month horizon. While the RBA remains relatively hawkish the resumption of falling underlying inflation since May tells us that the start of rate cuts here is getting closer.
Regards,
JMP Securities Team
JMP Securities
a. Level 3, ADF Haus, Musgrave St., Port Moresby NCD Papua New Guinea
p. PO Box 2064, Port Moresby NCD Papua New Guinea
Mobile (PNG):+675 72319913
Mobile (Int): +61 414529814
| STOCK | WEEKLY VOLUME |
CLOSING PRICE | VALUE | BID | OFFER | CHANGE | % CHANGE |
| BSP | 1,824 | 18.08 | 32,978 |
18.08 | – | 0.06 | 0.33% |
| KSL | 284,952 | 3.10 | 883,351 | 3.10 | 3.15 | 0.05 | 1.64% |
| STO | 1,255 | 19.45 | 24,410 | 19.45 | – | – | – |
| NEM | – | 150.00 | – | 148.00 | – | – | – |
| KAM | 1,000 | 1.40 | 1,400 | 1.30 | – | 0.10 | 7.69% |
| NGP | 2,905 | 0.75 | 2,179 | – | – | – | – |
| CCP | 1,625 | 2.51 | 4,079 | 2.51 | – | – | – |
| CPL | 14,135 | 0.69 | 9,753 | – | 0.69 | 0.01 | 0.40% |
| SST | 490 | 50.00 | 24,500 | – | 50.00 | (0.10) | (12.66%) |
| TOTAL | 2,890,875 |
WEEKLY YIELD CHART | 23 September August, 2024 – 27 September, 2024
| STOCK | NUMBER ISSUED OF SHARES |
MARKET CAP |
2023 INTERIM DIV | 2023 FINAL DIV | 2024 FINAL DIV | YIELD % LTM |
| BSP | 467,219,979 | 8,447,337,220 | K0.37 | K1.06 | K0.45 | 8.35% |
| KSL | 287,432,858 | 891,041,860 | K0.10 | K0.16 | K0.106 | 8.58% |
| STO | 3,247,772,961 | 63,169,184,091 | K0.31 | K0.66 | k0.506 | 5.99% |
| NEM* | – | – | – | – | – | – |
| KAM | 50,693,986 | 70,971,580 | K0.12 | – | K0.20 | 14.29% |
| NGP | 45,890,700 | 34,418,025 | K0.03 | – | K0.04 | 5.33% |
| CCP | 307,931,332 | 772,907,643 | K0.11 | K0.13 | K0.12 | 9.96% |
| CPL | 206,277,911 | 142,331,759 | K0.05 | – | – | – |
| SST | 31,008,237 | 1,550,411,850 | K0.35 | K0.60 | K0.40 | 2.00% |
| TOTAL | 75,078,604,029 |
a LTM = Last Twelve Months. We have calculated yields based on most recently declared interim and final dividends.
* NEM pays quarterly dividends. We have added last 4 payments at current FX rates.
NEM has been exluded from Market-wide yield calcs.
A couple of noteworthy items from the last couple of weeks:
- KAM announced a cracker of a dividend on 19 September 2024, being K0.20 per share taking the Last-Twelve-Months (LTM) dividend yield to a market leading 14.29%.
It is great to see strong performance by KAM in recent quarters and even more encouraging that this is reflected in the dividend payments to shareholders.
We should caution against shareholders thinking that dividends at these levels will be sustainable every year, however KAM has done a great job in positioning its portfolio thus far in 2024.
YTD 31 August 2024, KAM’s stock price had increased by 44.44%, whereas the NTA per share had increased by 21.12% over the same period. As of 30 September 2024, the share price had increased by a further K0.10, taking the full YTD share price increase to K0.50 or 55.56%. The 30 September 2024 NTA figures will only be released in the next week or so:
| DATE | NTA |
NTA GROWTH PGK | NTA GROWTH YTD PGK | NTA GROWTH YTD % | SHARE PRICE | SHARE PRICE GROWTH PGK | SHARE PRICE GROWTH YTD % | SHARE PRICE GROWTH YTD % | NTA GAP PGK | NTA GAP % |
| DEC-23 | 1.61 | 0.90 | 0.71 | 44.10% | ||||||
| JAN-24 | 1.64 | 0.03 | 0.03 | 1.86 | 0.90 | – | – | – | 0.74 | 45.12% |
| FEB-24 | 1.69 | 0.05 | 0.08 | 4.97 | 1.01 | 0.11 | 0.11 | 12.22% | 0.68 | 40.24% |
| MAR-24 | 1.73 | 0.04 | 0.12 | 7.45 | 1.15 | 0.14 | 0.25 | 27.78% | 0.58 | 33.53% |
| APR-24 | 1.74 | 0.01 | 0.13 | 8.07 | 1.20 | 0.05 | 0.30 | 33.33% | 0.54 | 31.03% |
| MAY-24 | 1.78 | 0.04 | 0.17 | 10.56 | 1.25 | 0.05 | 0.35 | 38.89% | 0.52 | 29.78% |
| JUNE-24 | 1.81 | 0.03 | 0.20 | 12.42 | 1.25 | – | 0.35 | 38.89% | 0.56 | 30.94% |
| JULY-24 | 1.87 | 0.06 | 0.26 | 16.15 | 1.25 | – | 0.35 | 38.89% | 0.62 | 33.16% |
| AUGUST-24 | 1.95 | 0.08 | 0.34 | 21.12 | 1.30 | 0.05 | 0.40 | 44.44% | 0.65 | 33.33% |
2. Another week, another record share price close for BSP. This time the stock closed at K18.08, up K0.06 or 0.33%. Volumes were very modest at only 1,824 shares traded for K32,978 in total turnover.
However a record is still a record.
3. All of the active listings except NEM traded during the week ended 27 September 2024. This is highly unusual and a really positive sign in the market. Although aggregate traded value was only K982,600, it was very pleasing to see price discovery for almost all of the shares on PNGX during the same week. Upwards and onwards we say!;
4. NGP (NGIP Agmark Limited) produced a cracker of a set of financials for the six months to 30 June 2024. Revenue was up 142% to K188.6 million compared to the previous corresponding period, driven mainly by the significant increase in global cocoa prices. Profit After Tax was up 367% to K8.8 million for the half year period. The dividend was increased from K0.03 to K0.04 per share;
5. CCP has consolidated its position above K2.50 per share with further modest volumes changing hands at K2.51 during the week;
6. The market has finally recorded a trade in CPL, with 14,135 shares changing hands at K0.69 during the week. This represents a drop of K0.10 since the last traded price, however when we consider that this is the first trade in the stock since the January riots which so heavily impacted on the company, we consider this to be a good outcome for shareholders and for the company. As the recovery for CPL continues, we hope for improved news-flow and a further return to the market of buyers for the stock; and
7. Last week was another busy week in fixed interest markets, with the 364-day Treasury Bill yields jumping another 0.09% to 7.31% – cementing the yield above the psychologically important 7.20% level which was held for a long period in the lead up to the drop that occurred in late 2021.
| AUCTION | MATURITY (YEARS) |
AMOUNT ON OFFER K’ MILLION |
BIDS RECEIVED K’ MILLION |
SUCCESSFUL BIDS K’MILLION |
SHORTFALL K’ MILLIONS |
FILL RATE % |
YIELD % |
| ISSUE 1D 2024/3384 | 2 | 70.00 | 80.00 | 70.00 | – | 100.00% | 100.00% |
| ISSUE 1D 2024/3385 | 3 | 70.00 | 40.00 | 30.00 | 40.00 | 42.86% | 100.00% |
| – | 4 | – | – | – | – | – | – |
| ISSUE 1D 2024/3386 | 5 | 100.00 | 10.00 | – | 100.00 | – | – |
| ISSUE 1D 2024/3387 | 6 | 100.00 | 10.00 | – | 100.00 | – | – |
| ISSUE 1D 2024/3397 | 7 | 100.00 | 10.00 | – | 100.00 | – | – |
| ISSUE 1D 2024/3398 | 8 | 100.00 | 20.00 | 10.00 | 90.00 | 10.00% | 8.50% |
| ISSUE 1D 2024/3399 | 9 | 130.00 | 22.50 | 12.50 | 117.50 | 9.62% | 8.70% |
| ISSUE 1D 2024/3400 | 10 | 130.00 | 12.50 | 12.50 | 117.50 | 9.62% | 8.90% |
| TOTAL | 800.00 | 205.00 | 135.00 | 665.00 | 16.88% |
The low volumes of bids received and even lower levels of bids accepted outside of the 2- and 3-years series, means that we arguably still don’t have meaningful price (or yield) discovery across the 10-year curve.
Such as it is, the PNG 10-year yield curve is a strange looking beast, with NIL premium applied between the 3-year and the 8-year series.
We suspect this will change with the next lot of auctions in the coming weeks and months. The macro-economic interpretation of the yield curve as it currently stands is a mystery to most of us we suspect:
What we have been reading
Shares around record highs as inflation slides – but what are the risks? – Olivers Insights AMP
Dr. Shane Oliver | CHead of Investment Strategy and Economics and Chief Economist, AMP Investments
Key points
– Recession risks, the escalating Israel conflict, the US election along with still stretched valuations mean a high risk of another share market correction and continued volatility.
– The expansion of the war around Israel and Iran attacking Israel with more missiles is very concerning but unless oil supplies are disrupted the impact on global growth and shares will remain limited.
– However, the combination of global rate cuts, still okay global economic growth and Chinese stimulus are very positive for shares on a six-to-12-month horizon.
– While the RBA remains relatively hawkish, the resumption of falling underlying inflation since May tells us that the start of rate cuts here is getting closer.
Introduction
August and September are often weak months but despite a few wobbles US, global and Australian shares rose to record highs. And consistent with the “risk on” sentiment metal prices, gold and the $A are up and the $US has fallen. The key drivers have been central banks cutting rates as inflation falls, still reasonable global growth and news of aggressive stimulus in China. But what are the risks and why is the RBA lagging on rates?
Central banks are winning the battle against inflation
Success in getting inflation down is the main driver of market cheer. Its surge depressed markets in 2022 (as higher inflation means higher interest rates and lower price to earnings multiples) and its decline has enabled them to rebound. In major developed countries it peaked around 8-11% in 2022 and has now fallen to around 2-3%.
Source: Bloomberg, AMP
This is enabling central banks to cut interest rates
The rise in inflation in 2021-22 was a classic case of too much money or demand (on the back of pandemic stimulus and then reopening) chasing too few goods and services (as supply was constrained). Its reversal reflects the reversal of fiscal stimulus, improved supply chains and monetary policy going from easy to tight. In particular, the aggressive monetary tightening helped slow demand and, by signalling that central banks were serious about getting inflation back to target, helped keep inflation expectations down. This in turn has made it easier to get inflation back down.
With inflation heading back to targets, central banks have been able to start cutting interest rates with nearly 50% of global central banks, including the Fed, now cutting. Money markets are expecting further easing ahead.
Source: Bloomberg, AMP
The good news has been that central banks have been able to get inflation back down without causing a collapse in global growth or sharply higher unemployment in contrast to the experience of the 1970s, 80s and 90s. Of course, conditions vary – with the US still strong and Europe weak – but global growth still looks on track to be around 3% this year.
This has also come at a time when the Chinese government has announced a big step up in policy stimulus. This included substantial monetary easing and a commitment to increased counter cyclical fiscal policies, “necessary” levels of fiscal spending and measures to stop the property decline.
So, shares celebrated. Apart from still stretched valuations, there are four key issues. Is recession still a risk? What about geopolitical threats including the Middle East? Will China stimulus work? And what about the RBA?
(Note: The US port strike is also a risk, but I doubt it will have a lasting impact – remember similar worries about Red Sea shipping disruptions and the Baltimore bridge collapse.)
What is the risk of a US recession?
Falling interest rates are positive for shares as they help boost economic and profit growth and make shares relatively more attractive than cash. So, the first rate cut after a hike tends to be positive for shares. Unless there is a recession! The table below shows the US share market’s response after the first rate cut since 1981. The US share market rose over the subsequent 3, 6 and 12 months after the commencement of 6 of the last 9 Fed easing cycles. The exceptions were after the rate cuts in 1981, 2001 and 2007 which were associated with recessions and the period after the first 2019 cut saw a “recession” and brief plunge in shares due to the pandemic. The reaction by the Australian shares to US rate cuts is similar.
US equity performance (S&P 500), % change, after first Fed cut
| First rate cut | +3mths | +6mths | +12mths |
| July 81 | -6.9 | -8.0 | -18.2 |
| Sept 84 | 0.7 | 8.8 | 9.6 |
| Nov 87 | 1.3 | 4.6 | 11.0 |
| June 89 | 9.8 | 11.1 | 12.6 |
| July 95 | 3.5 | 13.2 | 13.9 |
| Sep 98 | 20.9 | 26.5 | 26.1 |
| Jan 01 | -8.5 | -11.3 | -17.3 |
| Sept 07 | -4.3 | -12.4 | -20.6 |
| July 19 | 1.9 | 8.2 | 9.8 |
| Average | 2.0 | 4.5 | 3.0 |
US recession highlighted in red. Source: Thomson Reuters, AMP
And as can be seen in the next chart, recessions often start after the first Fed rate cut – so a cut doesn’t necessarily mean recession will be avoided.
Source: Bloomberg, AMP
Our base case is that the Fed has just headed off a recession and indications continue to show solid growth in the US. But a recession is a high risk with the US yield curve and leading indicators continuing to point to recession and US jobs leading indicators – for example, a sharp downtrend in job openings and quits – showing significant weakness. It’s a similar story in Australia – a traditional recession should be avoided but it’s a high risk.
Geopolitical threats – the Middle East and US election
There are two main geopolitical threats at present: the Middle East and the US election. While the expanding war around Israel to include Hezbollah is a big concern from a humanitarian perspective, the key from an investment perspective is whether global oil supplies are impacted. The risks on this front have increased with Iran (which accounts for 3% of global fuel supply) attacking Israel with more missiles – and oil prices bouncing 5% or so, but only taking them to week ago levels. It could just turn out to be another exchange of missiles between Iran and Israel as we saw in April. So, much will depend on Israel’s response – if its proportional and focussed on Iranian military facilities then the oil price and shares will quickly settle down again. This will be helped by Saudi Arabia raising production in December, Libyan oil production (1% of supply) resuming and rising non-OPEC production. If alternatively, Israel escalates with an attack on Iranian nuclear or oil facilities then we could be in for a much rougher ride in share markets as things escalate impacting oil supply.
Since Kamala Harris took over as the Democrat presidential candidate share markets have not been particularly focussed on the US election. However, this could change as the race remains close and Trump’s policies on tariffs, tax cuts and immigration risk a new trade war and higher inflation which would be bad for shares. Of course, Trump may moderate his policies, but this will not be known for a while.
Will China’s stimulus work?
China’s package of stimulus announcements over the last week show the Government is now serious about wanting to boost growth after a run of weak data. If the moves were limited to easy money then they may be less effective as the cost of money is already low and the key problem is a lack of demand for money. So fiscal stimulus is also needed and the Chinese authorities at last appear to recognise this with a surprise Politburo meeting committing to significant fiscal stimulus and measures to halt the property decline. Of course, the details are yet to be announced but this shift from cautious incremental stimulus towards “whatever it takes” is significant and very positive for cyclical assets like metal prices, Australian resources shares and the Chinese share market as we have seen in the last week. Whether it extends beyond providing a cyclical boost to growth to addressing China’s structural problems – which will require measures to clear the property overhang and permanently boost consumer spending – remains to be seen.
What about the RBA?
While other central banks have been easing, the RBA remains hawkish. This stems from a setback in falling inflation earlier this year. However, the key measures of underlying inflation have resumed falling. As can be seen in the next chart “trimmed mean” inflation (the RBA’s preferred measure of underlying inflation) is just following US core inflation down with a lag. So just as Australian inflation and the RBA followed global inflation and rates up with a lag in 2022 (due to a slower reopening from the pandemic) they now look to be following with a lag on the way down.
Source: Macrobond, AMP
The resumption of the downswing in underlying inflation provides confidence that rate cuts are getting closer. Our base case is that the RBA won’t cut until it’s seen lower underlying inflation in both the September and December quarters and so won’t start cutting until February next year. However, with inflation starting to follow a similar profile to that seen in the US, there is a high chance of a December cut if underlying inflation continues to fall as it has since May. The US experience with falling inflation despite still okay growth and low unemployment tells us the RBA’s concerns about excess demand in Australia may be overstated.
Concluding comments
Recession risks, the conflict in the Middle East, the US election along with still stretched valuations mean a high risk of another share market correction and continued bouts of volatility. However, the combination of global rate cuts, still okay global economic growth and Chinese stimulus are very positive for shares on a six-to-12-month horizon. While the RBA remains relatively hawkish the resumption of falling underlying inflation since May tells us that the start of rate cuts here is getting closer.
Regards,
JMP Securities Team
JMP Securities
a. Level 3, ADF Haus, Musgrave St., Port Moresby NCD Papua New Guinea
p. PO Box 2064, Port Moresby NCD Papua New Guinea
Mobile (PNG):+675 72319913
Mobile (Int): +61 414529814