22 October, 2024
Welcome to this week’s JMP Report,
Total value of trading amounted to K1,:
WEEKLY MARKET REPORT | 14 October, 2024 – 18 October, 2024
| STOCK | WEEKLY VOLUME |
CLOSING PRICE | VALUE | BID | OFFER | CHANGE | % CHANGE |
| BSP | 2,162 | 18.22 | 39,392 |
18.22 | – | 0.02 | 0.11% |
| KSL | 332,635 | 3.20 | 1,064,432 | 3.11 | 3.19 | 0.06 | 1.59% |
| STO | – | 19.45 | – | 19.60 | – | – | – |
| NEM | – | 150.00 | – | 147.00 | – | – | – |
| KAM | – | – | – | 1.75 | 1.90 | – | – |
| NGP | – | 0.75 | – | – | 1.00 | – | – |
| CCP | 959 | 2.60 | 2,493 | 2.60 | – | – | – |
| CPL | – | 0.69 | – | – | 0.69 | – | – |
| SST | – | 50.00 | 1,900 | – | 50.00 | – | – |
| TOTAL | 1,106,317 |
0.03% |
WEEKLY YIELD CHART | 14 October, 2024 – 18 October, 2024
| STOCK | NUMBER ISSUED OF SHARES |
MARKET CAP |
2023 INTERIM DIV | 2023 FINAL DIV | 2024 FINAL DIV | YIELD % LTM |
| BSP | 467,219,979 | 8,512,748,017 | K0.370 | K1.060 | K0.450 | 8.29% |
| KSL | 287,432,858 | 919,785,146 | K0.100 | K0.160 | K0.106 | 8.31% |
| STO | 3,247,772,961 | 63,169,184,091 | K0.310 | K0.660 | k0.506 | 5.99% |
| NEM* | – | – | – | – | – | – |
| KAM | 50,693,986 | 70,971,580 | K0.120 | – | K0.200 | 14.29% |
| NGP | 45,890,700 | 34,418,025 | K0.030 | – | K0.040 | 5.33% |
| CCP | 307,931,332 | 800,621,463 | K0.110 | K0.130 | K0.120 | 9.62% |
| CPL | 206,277,911 | 142,331,759 | K0.050 | – | – | – |
| SST | 31,008,237 | 1,550,411,850 | K0.350 | K0.600 | K0.400 | 2.00% |
| TOTAL | 75,200,471,932 | 6.24% |
a LTM = Last Twelve Months. We have calculated yields based on most recently declared
interim and final dividends.
* NEM pays quarterly dividends. We have added last 4 payments at current FX rates.
Key takeaways:
-
BSP up another K0.02 during the week to K18.22 but with only 2,162 shares changing hands.
-
CCP consolidating at K2.60 with modest volumes at 959 shares and total value of trades at only K2,493.
-
KSL held rose to K3.20 during the week with 332,635 shares traded for total value of K1,064,432. In the absence of consistent volume of BSP shares in the market – largely on account of the dearth in sellers – KSL is accounting for the bulk of volumes.
-
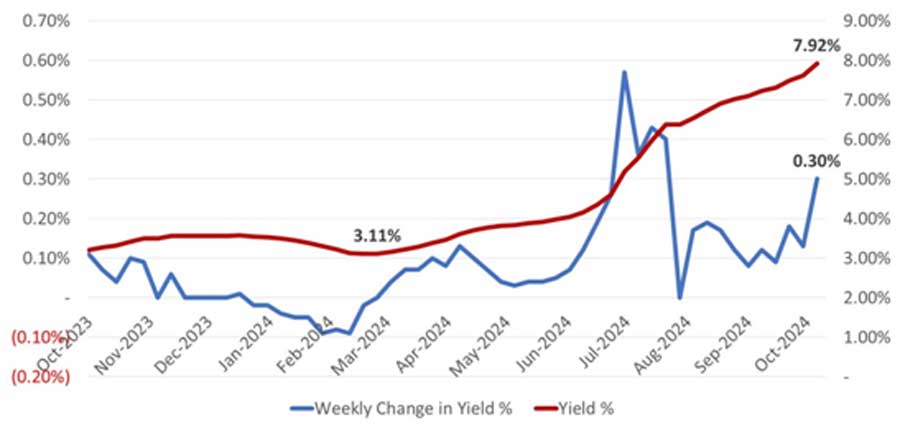
364-day Treasury Bills rose significantly during the week, with yields rising to 7.92%, up 0.30% for the week. There was a considerable shortfall in the volumes of accepted bids during the week:
JMP put out an Investor Note in relation to the current state of fixed interest markets during the week and we have attached a link to this report here:
DOWNLOAD PNG FIXED INTEREST MARKET UPDATE
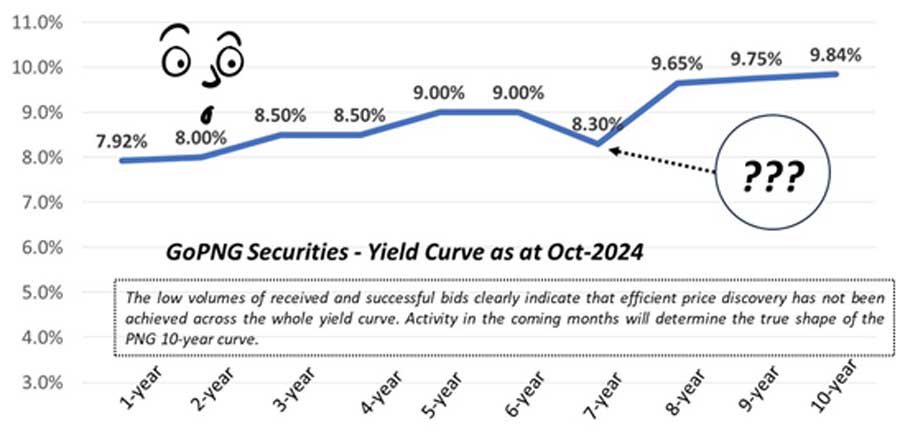
- BPNG held a modest GIS auction during the week, looking for a total of K100 million across long-dated series.
- The auction results were patchy at best, resulting in a slight upward revision in the current yield curve. However, we do not yet think that the yield curve is reflective of the true cost of long-dated borrowing and will await deeper transaction volumes before the final shape of the curve is settled:
What we have been reading
Nine bad habits of ineffective investors: common mistakes investors make

Dr Shane Oliver – Head of Investment Strategy and Economics and Chief Economist, AMP Investments | October 22, 2024
Key points
– Many of the mistakes investors make are based on common sense rules of thumb that turn out to be wrong.
– As a result, it’s often wise for investors to turn common sense logic on its head.
– The easiest way to avoid many of these mistakes is to have a long-term investment plan that aligns your financial goals with your risk tolerance.
Introduction
In the confusing and often seemingly illogical world of investing, investors often make various mistakes that keep them from reaching their financial goals. This note takes a look at the nine most common mistakes.
Mistake #1 Crowd support indicates a sure thing
“I will tell you how to become rich…Be fearful when others are greedy. Be greedy when others are fearful.” Warren Buffett, investor and CEO
It’s normal to feel safer investing in an asset when your friends and neighbours are doing the same and media commentary is reinforcing the message that it’s the place to be. But “safety in numbers” is often doomed to failure. The trouble is that when everyone is bullish and has bought into an investment with general euphoria about it, it gets to a point where there is no one left to buy in the face of more positive supporting news but instead there are lots of people who can sell if the news turns sour. Of course, the opposite applies when everyone is pessimistic & bearish and have sold – it only takes a bit of good news to turn the value of the asset back up. So, the point of maximum opportunity is when the crowd is pessimistic (or fearful) and the point of maximum risk is when the crowd is euphoric (and greedy).
Mistake #2 Current returns are a guide to the future
“Past performance is not a reliable indicator of future performance.” Standard disclaimer
Faced with lots of information, investors often use simplifying assumptions, or rules, in order to process it. A common one of these is that “recent returns or the current state of the economy and investment markets are a guide to the future.” So tough economic conditions and recent poor returns are expected to continue and vice versa for good returns and good economic conditions. The problem with this is that when it’s combined with the “safety in numbers” mistake, it results in investors getting in at the wrong time (e.g. after an asset has already had strong gains) or getting out at the wrong time (e.g. when it is bottoming). In other words, buying high and selling low.
This is pertinent now with shares providing strong gains over the last two years – with US shares up 56%, global shares up 49% and Australian shares up 25% – despite lots of worries about interest rates, recession, commercial property & US banks, wars, elections, etc. This has brought with it a temptation to conclude we are in a “new era” where macro problems don’t matter and that even if they do central banks will protect us by slashing rates and pumping money in (the so-called “central bank put” which morphed from the “Greenspan put” many years ago) and governments will do the same with government spending. Unfortunately, we have heard the “this time is different” argument many times before only to find out that it’s not – usually when we are most complacent! The reality is that shares have done well over the last two years because they came off a big cyclical fall in 2022 and the threats have not proved that serious economically. For instance, the much-feared recession has failed to appear and the war in the Middle East has not disrupted global oil supplies (so far). And the “central bank put” did not prevent the tech wreck & the GFC (both saw US shares fall around 50%) & various other share market plunges. Just because shares have had strong returns over the last two years – despite lots of worries – doesn’t mean that the cycle has been abolished and that there is nothing at all to worry about.
Mistake #3 “Experts” will tell you what will happen
“Economists put decimal points in their forecasts to show that they have a sense of humour.” William Gillmore Simms, novelist and politician
The reality is that no one has a perfect crystal ball. It’s well-known that forecasts as to where the share market, property market, and currencies will be at a particular time have a dismal track record, so they need to be treated with care. Usually the grander the forecast – calls for “new eras of permanent prosperity” or for “great crashes ahead” – the greater the need for scepticism as either they get the timing wrong or it’s dead wrong.
Market prognosticators suffer from the same psychological biases as everyone else. And sometimes forecasts themselves can set in motion policy changes that make sure they don’t happen – such as rate cuts heading off sharp house price falls in the pandemic in 2020. The key value of investment experts is to provide an understanding of the issues around an investment and to put things in context. This can provide valuable information in terms of understanding the potential for an investment. But if forecasting was so easy, the forecasters would be rich and so would have retired!
Mistake #4 Shares can’t go up in a recession…
“It’s so good it’s bad, it’s so bad it’s good.” Anon
A common lament around in second half 2020, after share markets rebounded from their late March 2020 pandemic low, was that, “the share market is crazy as the economy is in deep recession and earnings are collapsing!” Of course, shares kept rising into 2022, economies recovered, and earnings rebounded. The reality is that share markets are forward looking, so when economic data and profits are really weak, the market has already factored it in. History tells us that the best gains in stocks are usually made when the economic news is still poor, as stocks rebound from being undervalued and unloved, helped by falling interest rates. In other words, things are so bad they are actually good for investors! Of course, the opposite applies at market tops after a sustained economic recovery has left the economy overheated with no spare capacity and rising inflation and so the share market frets about rising rates. Hence things are so good they become bad! This seemingly perverse logic often trips up many investors.
Mistake #5 Letting a strongly held view get in the way
“The aim is to make money, not to be right.” Ned Davis, investment analyst
Many let their blind faith in a strongly held, often bearish, view – “there is too much debt”, “aging populations will destroy returns”, “a house price crash is imminent”, “a Trump victory will see shares crash”, etc – drive their investment decisions. This is easy to do as the human brain is wired to focus on the downside more than the upside, so we are easily attracted to doomsayers. They could be right one day but lose a lot of money in the interim. Giving too much attention to pessimists doesn’t pay for investors.
Mistake #6 Looking at your investments too much
“Investing should be like watching paint dry or watching grass grow. If you want excitement…go to Las Vegas.” Paul Samuelson, economist
Checking up on how your investments are doing is a good thing, surely? But the danger is that the more investors are exposed to news around their investments, the more they may see them falling. Whereas share markets have historically generated positive returns more than 60% of the time on a monthly basis and more than 70% of the time on a calendar year basis, day-to-day it’s close to 50/50 as to whether the share market will be up or down.
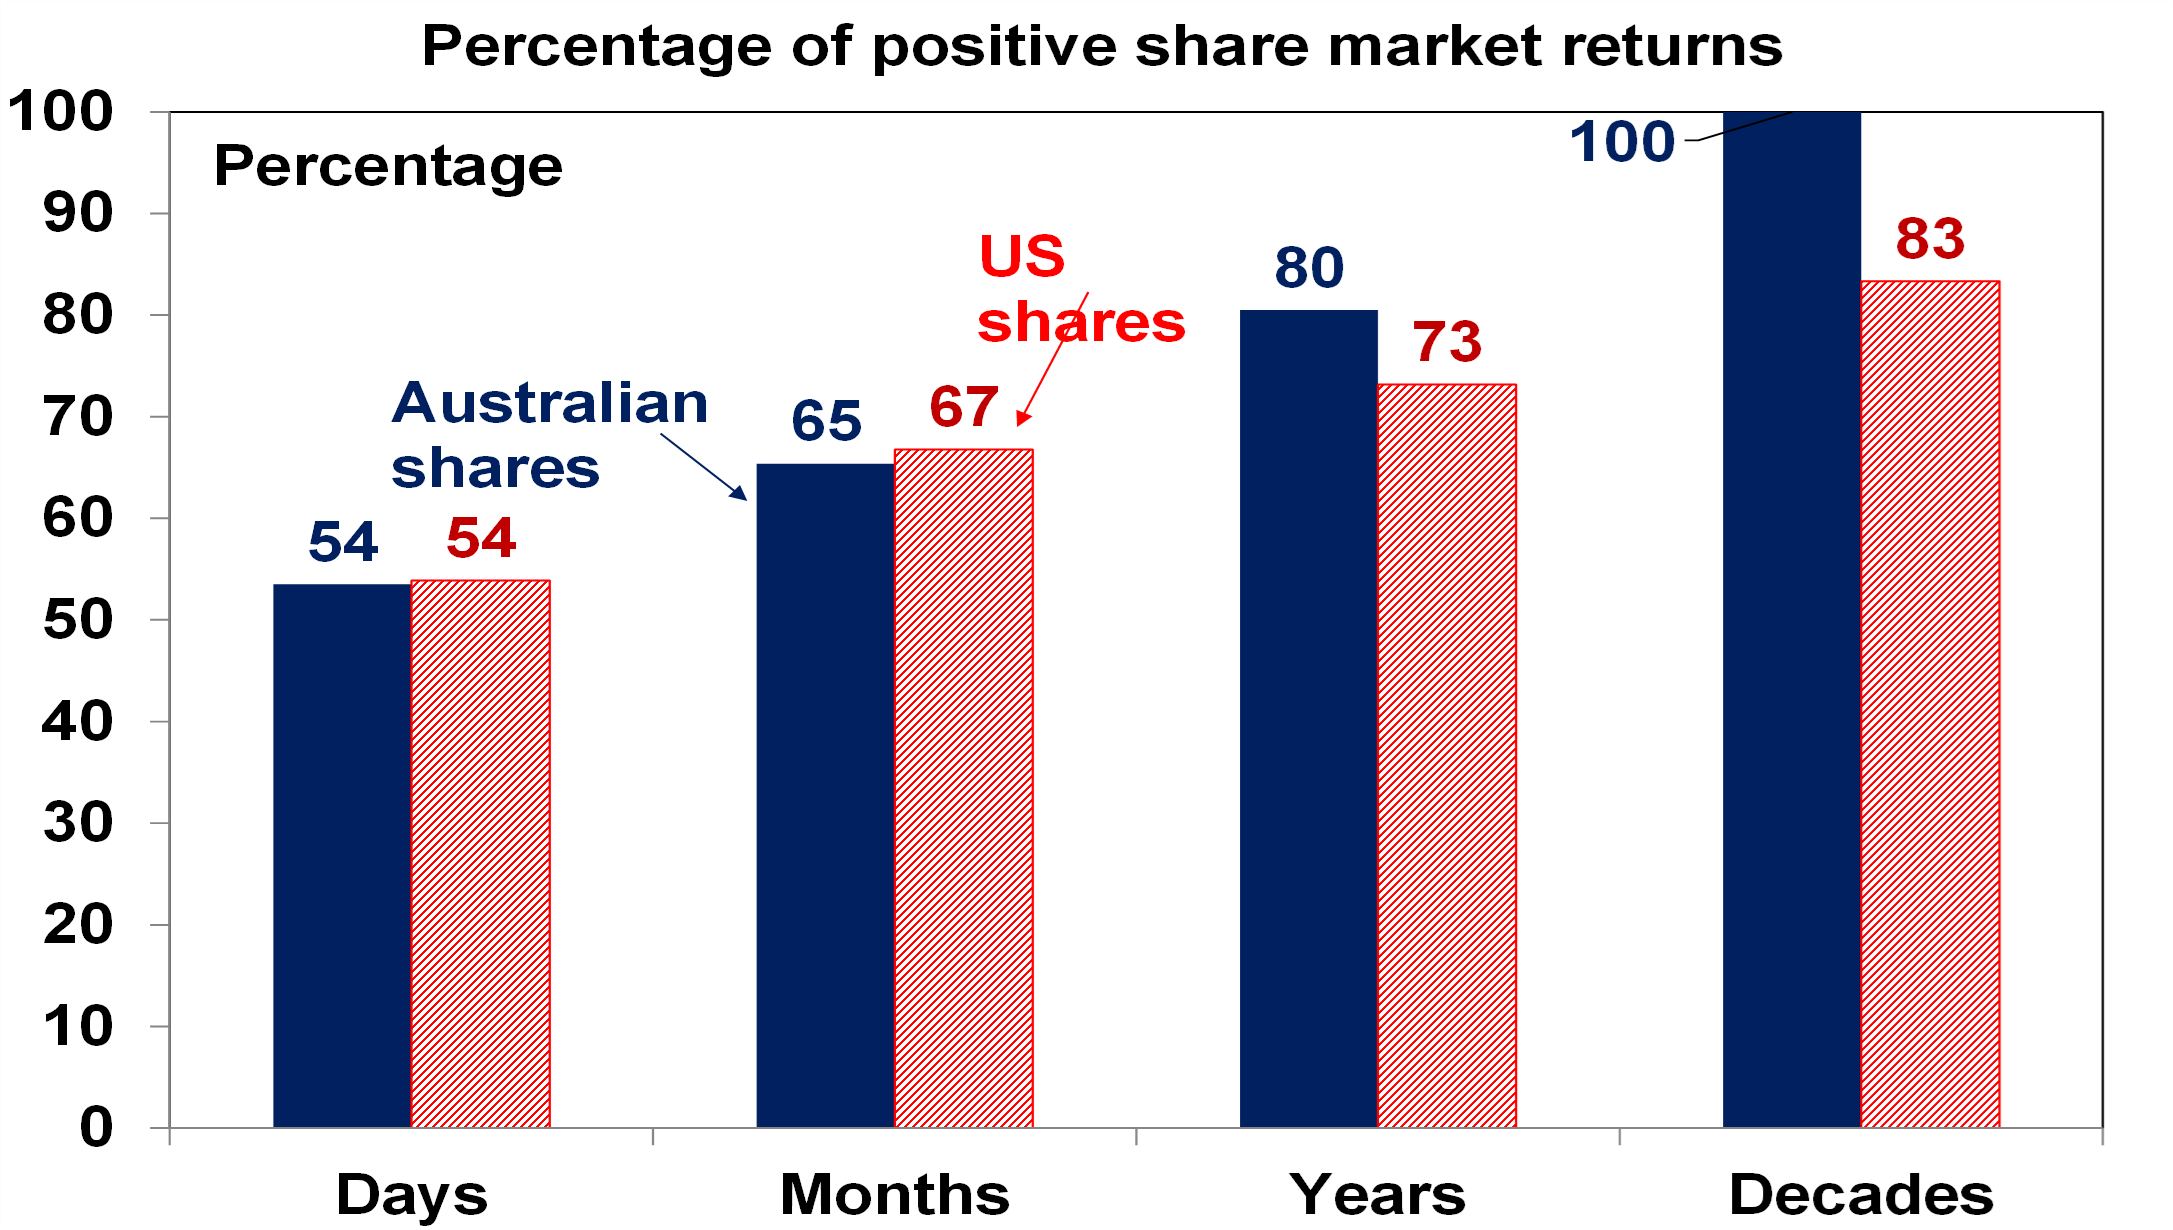
Daily & monthly data from 1995, data for years and decades from 1900. Source: Bloomberg, AMP
Being exposed to this very short term “noise” and the chatter around it can cause investors to have a greater exposure to lower returning but safer investments that won’t grow wealth. The trick is to turn down the noise and have patience. Evidence shows that patient people make better investors because they can look beyond short-term noise and are less inclined to jump into one investment after another after they have already had their run.
Mistake #7 Making investing too complex
“There seems to be a perverse human characteristic that makes easy things difficult.” Warren Buffett
With the increasing ease of access to investment options, ways to put them together and information & processes to assess them, investing is getting more complex. But when you overcomplicate your investments, it can mean that you can’t see the wood for the trees. You can spend so much time focussing on this stock or ETF versus that stock or ETF or this fund manager versus that fund manager that you ignore the key driver of your portfolio’s risk and return which is how much you have in shares, bonds, real assets, cash, onshore versus offshore, etc. Or that you end up in things you don’t understand. Instead, it’s best to avoid the clutter, don’t fret the small stuff, keep it simple and don’t invest in things you don’t understand.
Mistake #8 Too conservative early in life
“Compound interest is the eighth wonder of the world. He who understands it, earns it…he who doesn’t, pays it.” Albert Einstein, theoretical physicist
Cash and bank deposits are low risk and fine for near term spending requirements and emergency funds, but they won’t build wealth over time. The chart below shows the value of $1 invested in various Australian assets since 1900 allowing for the reinvestment of interest and dividends along the way. That $1 would have grown to $955,656 if invested in shares but only to $263 if invested in cash. Despite periodic setbacks, shown with arrows (such as WWI, the Great Depression, WWII, stagflation in the 1970s, the 1987 share crash & the GFC), shares and other growth assets grow to much higher values over time thanks to their higher returns over the long term than cash and bonds and thanks to the magic of compound interest where higher returns build on higher returns through time.
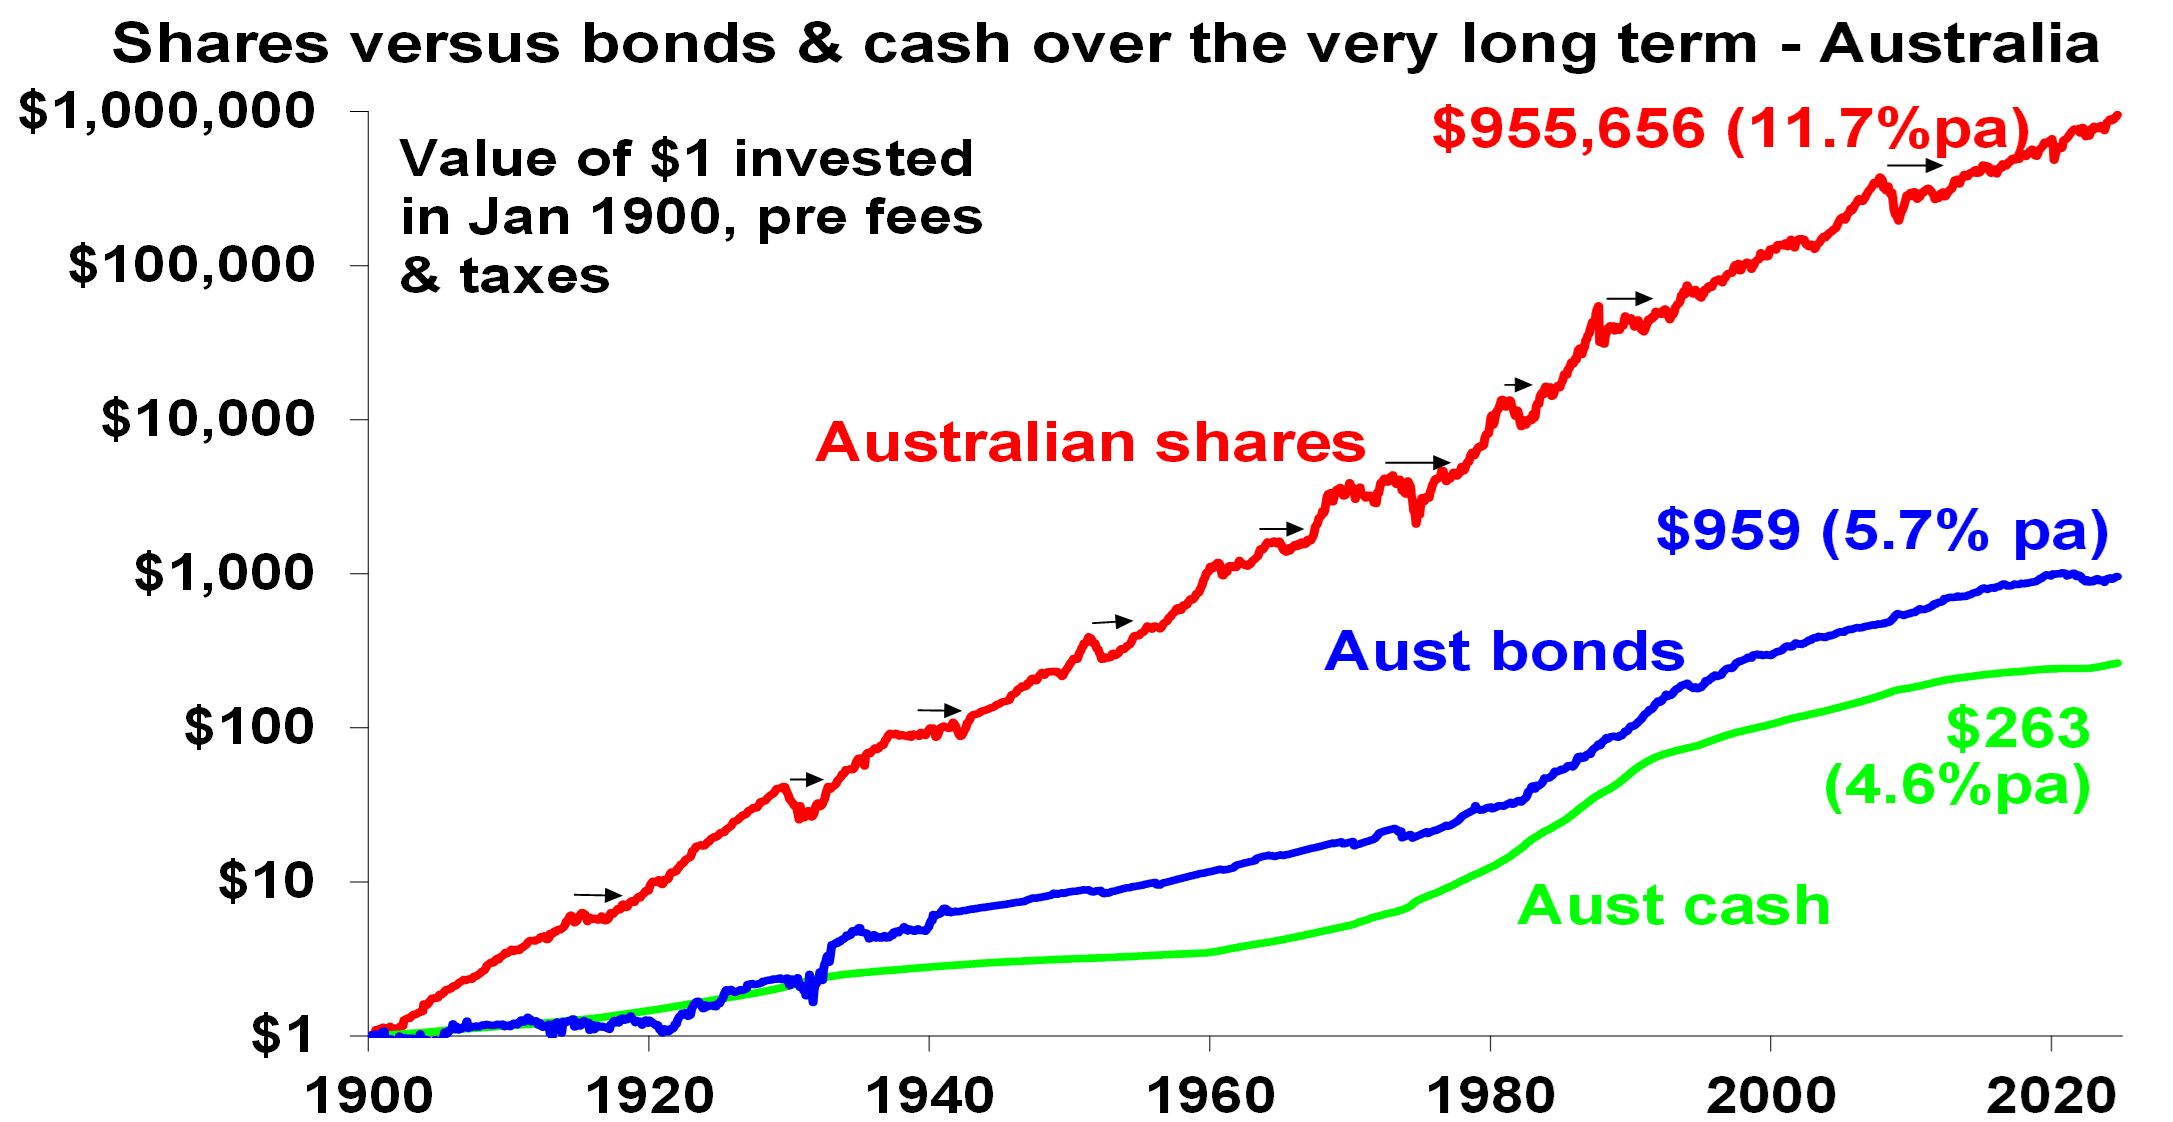
Source: ASX. Bloomberg, RBA, AMP
Not having enough in growth assets early in their career can be a problem for investors as it can make it harder to adequately fund retirement later in life as they miss out on the magic of compounding higher returns on higher returns through time in growth assets like shares and property. Fortunately, compulsory superannuation in Australia helps manage this – although early super withdrawal for various purposes (through the pandemic, for medical needs and as proposed for housing) may set this back for some. For example, a 30 year old who withdraws $20,000 from their super could have around $184,000 (or $74,000 in today’s dollars) less when they retire at age 67 based on assumptions in the ASIC MoneySmart Super Calculator.
Mistake #9 Trying to time the market
“Far more money has been lost by investors in preparing for corrections, or anticipating corrections, than has been lost in the corrections themselves.” Peter Lynch, fund manager
In the absence of a tried and tested process, trying to time the market, ie, selling before falls and buying ahead of gains is very difficult. Many of the mistakes referred to above kick in and it can be a sure way to destroy wealth. Perhaps the best example of this is a comparison of returns if the investor is fully invested in shares versus missing out on the best days. Of course, if you can avoid the worst days during a given period you will boost your returns. But this is very hard and many investors only get out after the bad returns occur, just in time to miss out on some of the best days and so hurt their returns. If you were fully invested in Australian shares from January 1995, you would have returned 9.5% pa (including dividends but not allowing for franking credits). But if by trying to time the market you miss the 10 best days the return falls to 7.5% pa. If you miss the 40 best days, it drops to just 3.5% pa. Hence, it’s time in the market that’s the key, not timing the market. The last two years provide a classic example of how hard it is to time markets – there has been a long worry list, so it’s been easy to be gloomy but timing markets on the back of this has been a loser as shares put in strong gains.
Concluding comment
I know it sounds kind of boring and like a cliché, but the easiest way to overcome many of these mistakes is to have a long-term investment plan that allows for your goals and risk tolerance and then stick to it.
Silver’s High Was Different

Ainslie Bullion|Posted 22/10/2024
In the world of bullion trading, it’s easy to become immersed in the day-to-day activities of helping clients buy and sell precious metals. Despite closely following market movements, the significant price performance of silver in 2024 may still take some by surprise. In recent discussions with clients about the differences between gold and silver, it’s not uncommon to lean towards the idea that gold had shown greater movement earlier in the year. However, upon closer inspection, silver has actually outperformed gold by a few percentage points, something that can easily be overlooked due to biases surrounding price perception.
A multi-thousand-dollar price per ounce for gold increasing in value can be inherently more captivating and impressive than an AU$40-50 per ounce silver price moving positively. While it’s certainly been an impressive run for gold over the past two years, there comes a point where some people believe it’s too expensive. Although this perspective is debatable, there is a growing sentiment that lower-priced items, like silver, seem more accessible and have a greater potential for further gains. This unit bias can drive investor behaviour, making silver an appealing alternative for those looking to capitalise on its potential in the short to medium term.
This time was different
This year, the price of gold has hit an all-time high in U.S. dollars a total of 34 times. To the eye, the price performance has been ultra-strong.
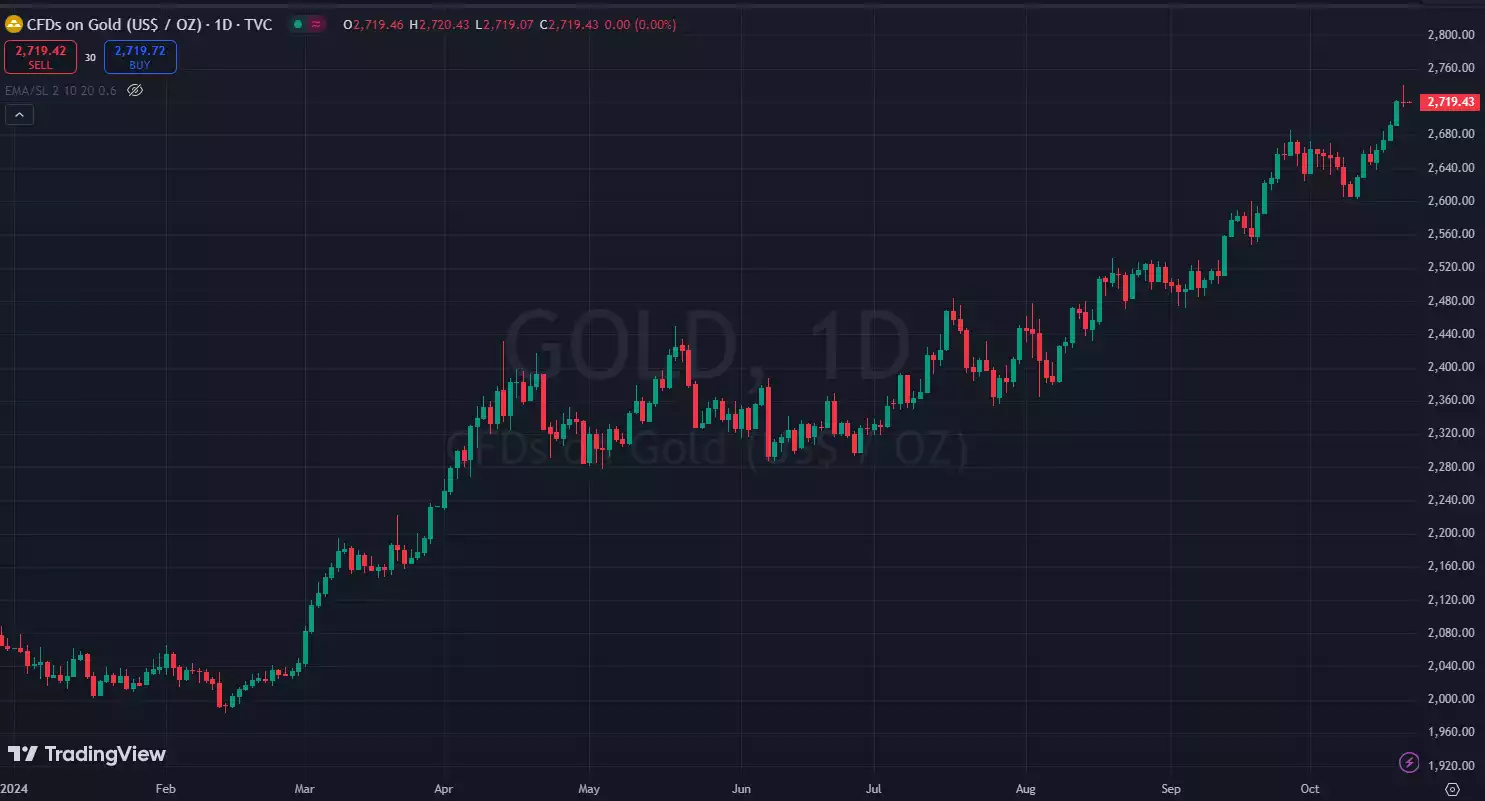 Price of Gold 1 Day Chart Yearly 2024 – October 2024
Up until silver’s rampaging 6% daily gain on Friday, and despite its strong gains overall in 2024, the chart hasn’t looked so pretty because it wasn’t making new highs. Friday was significant in that not only did gold make a new high, but silver hit an 11-year high against the U.S. dollar. It feels like a new era is upon us.
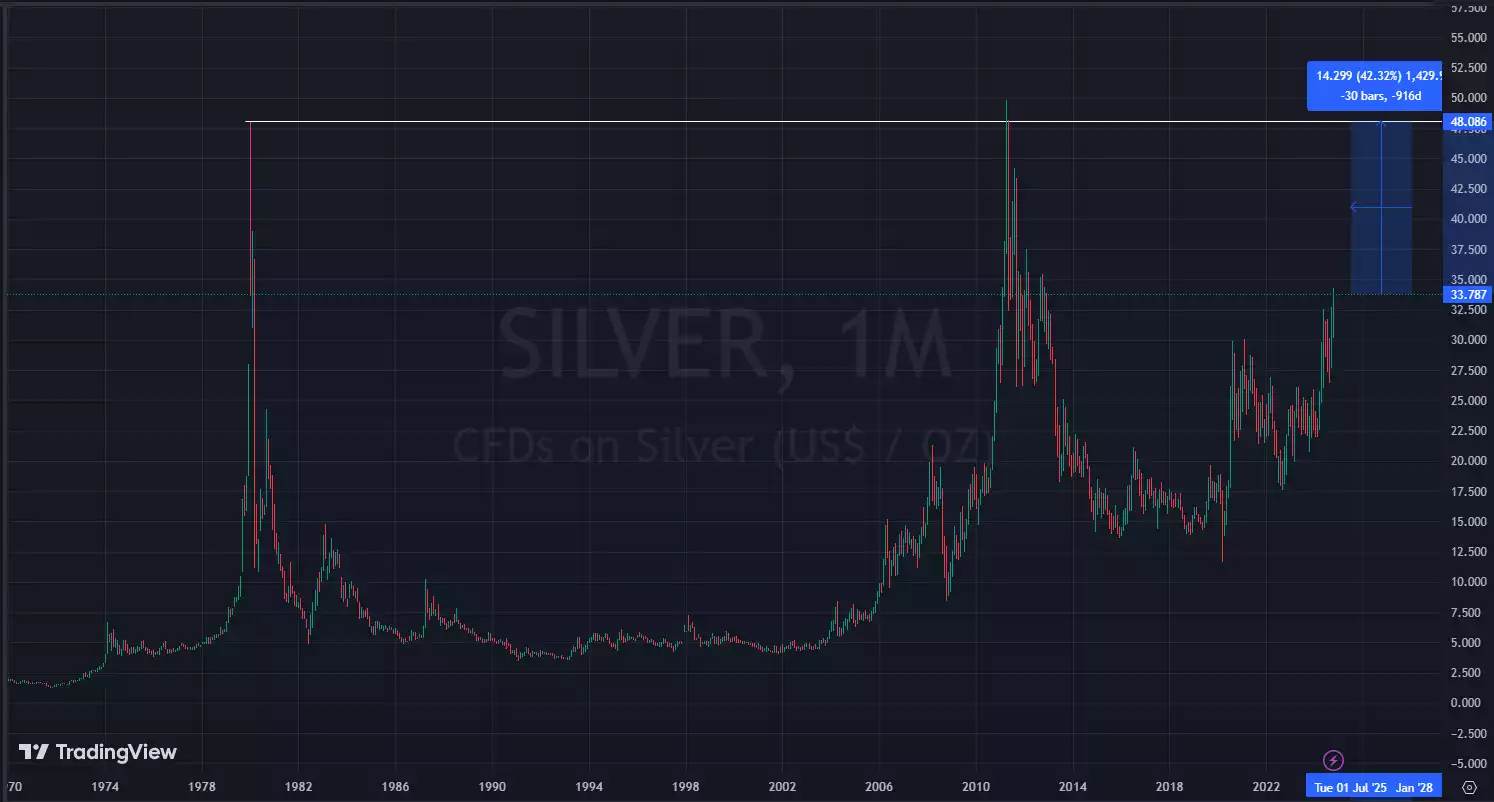 Price of Silver 1 Month Chart 1970 to 2024
As we zoom out on the Silver/USD chart, we can see that there’s a key price level ahead at around US$48 which was last reached in June 2011 and before that, in January 1980. 1980! Germany was split in two, fax machines weren’t yet mainstream, the Australian cricket team weren’t very good, and hair was very, very large. This could be the mother of all long-term breakout setups that we need to keep an eye on.
The gold-to-silver ratio will become more and more of a focus as the tide shifts between the relative dominance of the two metals. As we discussed in last week’s article, this may be an excellent opportunity for investors to exploit a once-in-100-year trade.
Despite the macroeconomic and geopolitical environment remaining very favourable for precious metals investors, prices will need to take a breather at some point as profits are taken and price consolidates. This will be a great time to stack more metals and having some cash available could be very rewarding.
Regards,
JMP Securities Team
JMP Securities
a. Level 3, ADF Haus, Musgrave St., Port Moresby NCD Papua New Guinea
p. PO Box 2064, Port Moresby NCD Papua New Guinea
Email: lars.mortensen@jmpmarkets.com
Ph: +675 7200 2233
Mobile: +675 7056 5124
Email: nathan.chang@jmpmarkets.com
Ph: +675 7167 3223
Mobile: +61 422 113 630