30 October, 2024
Welcome to this week’s JMP Report,
Total value of trading amounted to K1,066,901, with 5 different securities trading during the week:
WEEKLY MARKET REPORT | 21 October, 2024 – 25 October, 2024
| STOCK | WEEKLY VOLUME |
CLOSING PRICE | VALUE | BID | OFFER | CHANGE | % CHANGE |
| BSP | 12,279 | 19.00 | 233,301 |
19.00 | – | 0.78 | 4.28% |
| KSL | 177,962 | 3.18 | 565,919 | 3.11 | 3.18 | (0.02) | (0.63)% |
| STO | – | 19.45 | – | 19.65 | – | – | – |
| NEM | – | 150.00 | – | 169.00 | – | – | – |
| KAM | 82,080 | 1.75 | 143,640 | 1.75 | 1.90 | 0.35 | 25.00% |
| NGP | 10,723 | 1.00 | 10,723 | – | 1.00 | 0.25 | 33.33% |
| CCP | 43,251 | 2.62 | 113,318 | 2.61 | – | 0.02 | 0.77% |
| CPL | – | 0.69 | – | – | 0.69 | – | – |
| SST | – | 50.00 | – | – | 50.00 | – | – |
| TOTAL | 1,066,901 |
0.55% |
Key takeaways:
- NGP was the week’s standout performer, rising 33% to close at K1.00 – just rewards for the shareholders considering the very strong half year results.
- KAM also rose significantly, closing at K1.75 – up 25% for the week. Again, no doubt a reflection of the strong H1 results and the very healthy recent dividends.
- Another sterling week for BSP with 12,279 shares trading and the stock reaching a new all-time high of K19.00 per share.
- This represents an increase of more than 4.28% for the week and means BSP is up more than 38% for the year, having closed out 2023 at K13.70.
- Adding the K1.06 in dividends paid in March 2024, the total return (capital gain + dividends) YTD amounts to a total of K6.36 or 46.4%.
- CCP reached a new high of K2.62 on reasonable volumes of 43,251 shares traded. This takes its YTD share price increase to a total of K0.57 or 27.8%. The addition of K0.12 in dividends paid earlier this year yields a total return YTD of K0.69 per share or 33.6% – another sterling performance from a leading PNGX listed stock.
- KSL was down K0.02 to K3.18 per share on good volumes of 177,562, underscoring the recent trend where the stock has underpinned a large proportion of overall volumes in recent months.
WEEKLY YIELD CHART | 21 October, 2024 – 25 October, 2024
| STOCK | NUMBER ISSUED OF SHARES |
MARKET CAP |
2023 INTERIM DIV | 2023 FINAL DIV | 2024 FINAL DIV | YIELD % LTM |
| BSP | 467,219,979 | 8,877,179,601 | K0.370 | K1.060 | K0.450 | 7.95% |
| KSL | 287,949,279 | 915,678,707 | K0.100 | K0.160 | K0.106 | 8.35% |
| STO | 3,247,772,961 | 63,169,184,091 | K0.310 | K0.660 | k0.506 | 5.99% |
| NEM* | – | – | – | – | – | – |
| KAM | 50,693,986 | 88,714,476 | K0.120 | – | K0.200 | 11.43% |
| NGP | 45,890,700 | 45,890,700 | K0.030 | – | K0.040 | 4.00% |
| CCP | 307,931,332 | 806,780,090 | K0.110 | K0.130 | K0.120 | 9.54% |
| CPL | 206,277,911 | 142,331,759 | K0.050 | – | – | – |
| SST | 31,008,237 | 1,550,411,850 | K0.350 | K0.600 | K0.400 | 2.00% |
| TOTAL | 75,596,171,274 | 6.20% |
a LTM = Last Twelve Months. We have calculated yields based on most recently declared
interim and final dividends.
* NEM pays quarterly dividends. We have added last 4 payments at current FX rates.
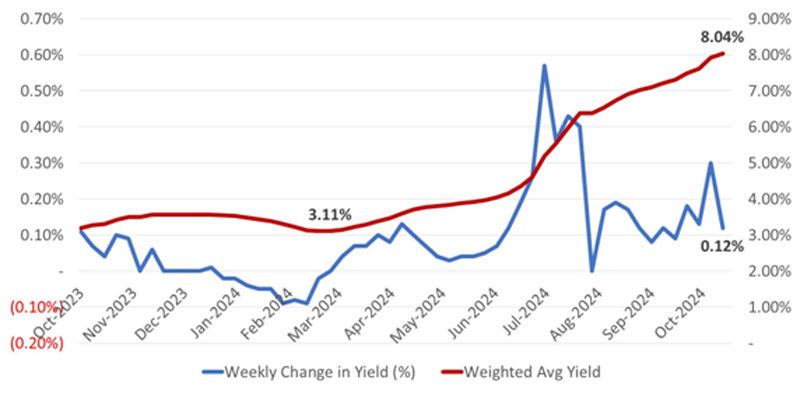
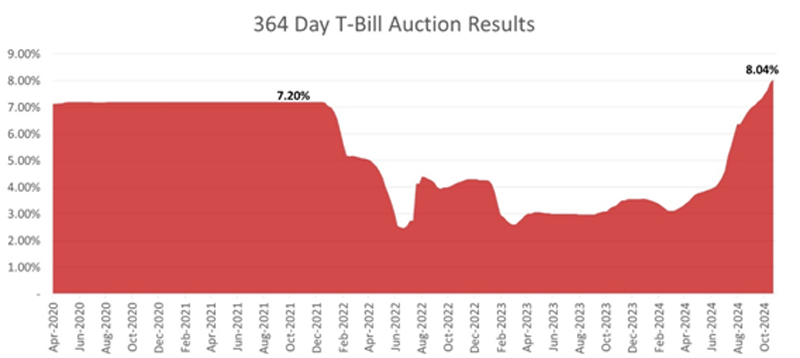
- Another week, another rise in 364-day Treasury Bill rates. Last week saw the Weighted Average Rate (WAR) of accepted bids rise by another 12bps to 8.04% – continuing the unrelenting rise in rates this year:
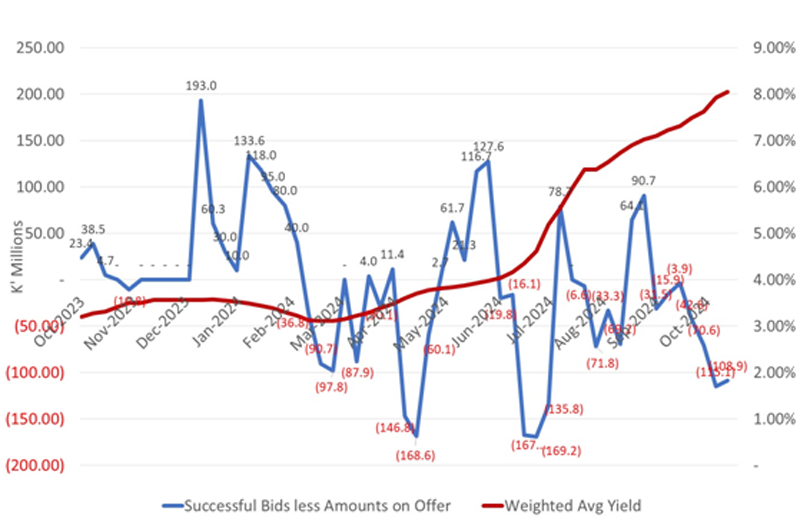
- There were significant shortfalls in the volumes of accepted bids when compared with the aggregate volumes targeted by BPNG, indicating that yields may have further upward momentum in coming weeks.
What we have been reading
Why value matters in investing – and what are valuations telling us now?

Dr Shane Oliver – Head of Investment Strategy and Economics and Chief Economist, AMP Investments | October 29, 2024
Key points
– Starting point valuations – like yields and price to earnings ratios – are key drivers of medium-term investment returns.
– Valuation starting points for term deposits and bonds have improved. For shares they suggest constrained return potential, particularly from US shares but Australian, European and Chinese shares are a bit more attractive.
Introduction
The concept of value or valuation is central to investing as the cheaper you buy an asset the higher its prospective return might be. However, this is frequently forgotten with investors tempted to project recent returns into the future regardless of valuations and periodically – usually after periods of strong gains – some argue that they don’t matter anymore. But looking at value now is pertinent as shares have had a good run and on some measures are stretched – particularly for US shares. For example, a recent Goldman Sachs study concluded that based on current valuations along with various other variables US shares will return around just 3% pa over the next 10 years.
Cash & bonds offer better returns than three yrs ago
By its nature valuation is a relative concept usually expressed relative to the income flow an investment will produce. This makes the valuation of cash and bonds relatively simple but for shares it can get more slippery and for things like gold and Bitcoin it can get really hard as there is no real income. The good news for cash and bonds is that the rise in interest rates since 2022 has improved their valuations as they are now providing more interest income. That said term deposit rates are still well below levels around 6-7% in 2010 and have started to soften ahead of RBA rate cuts.
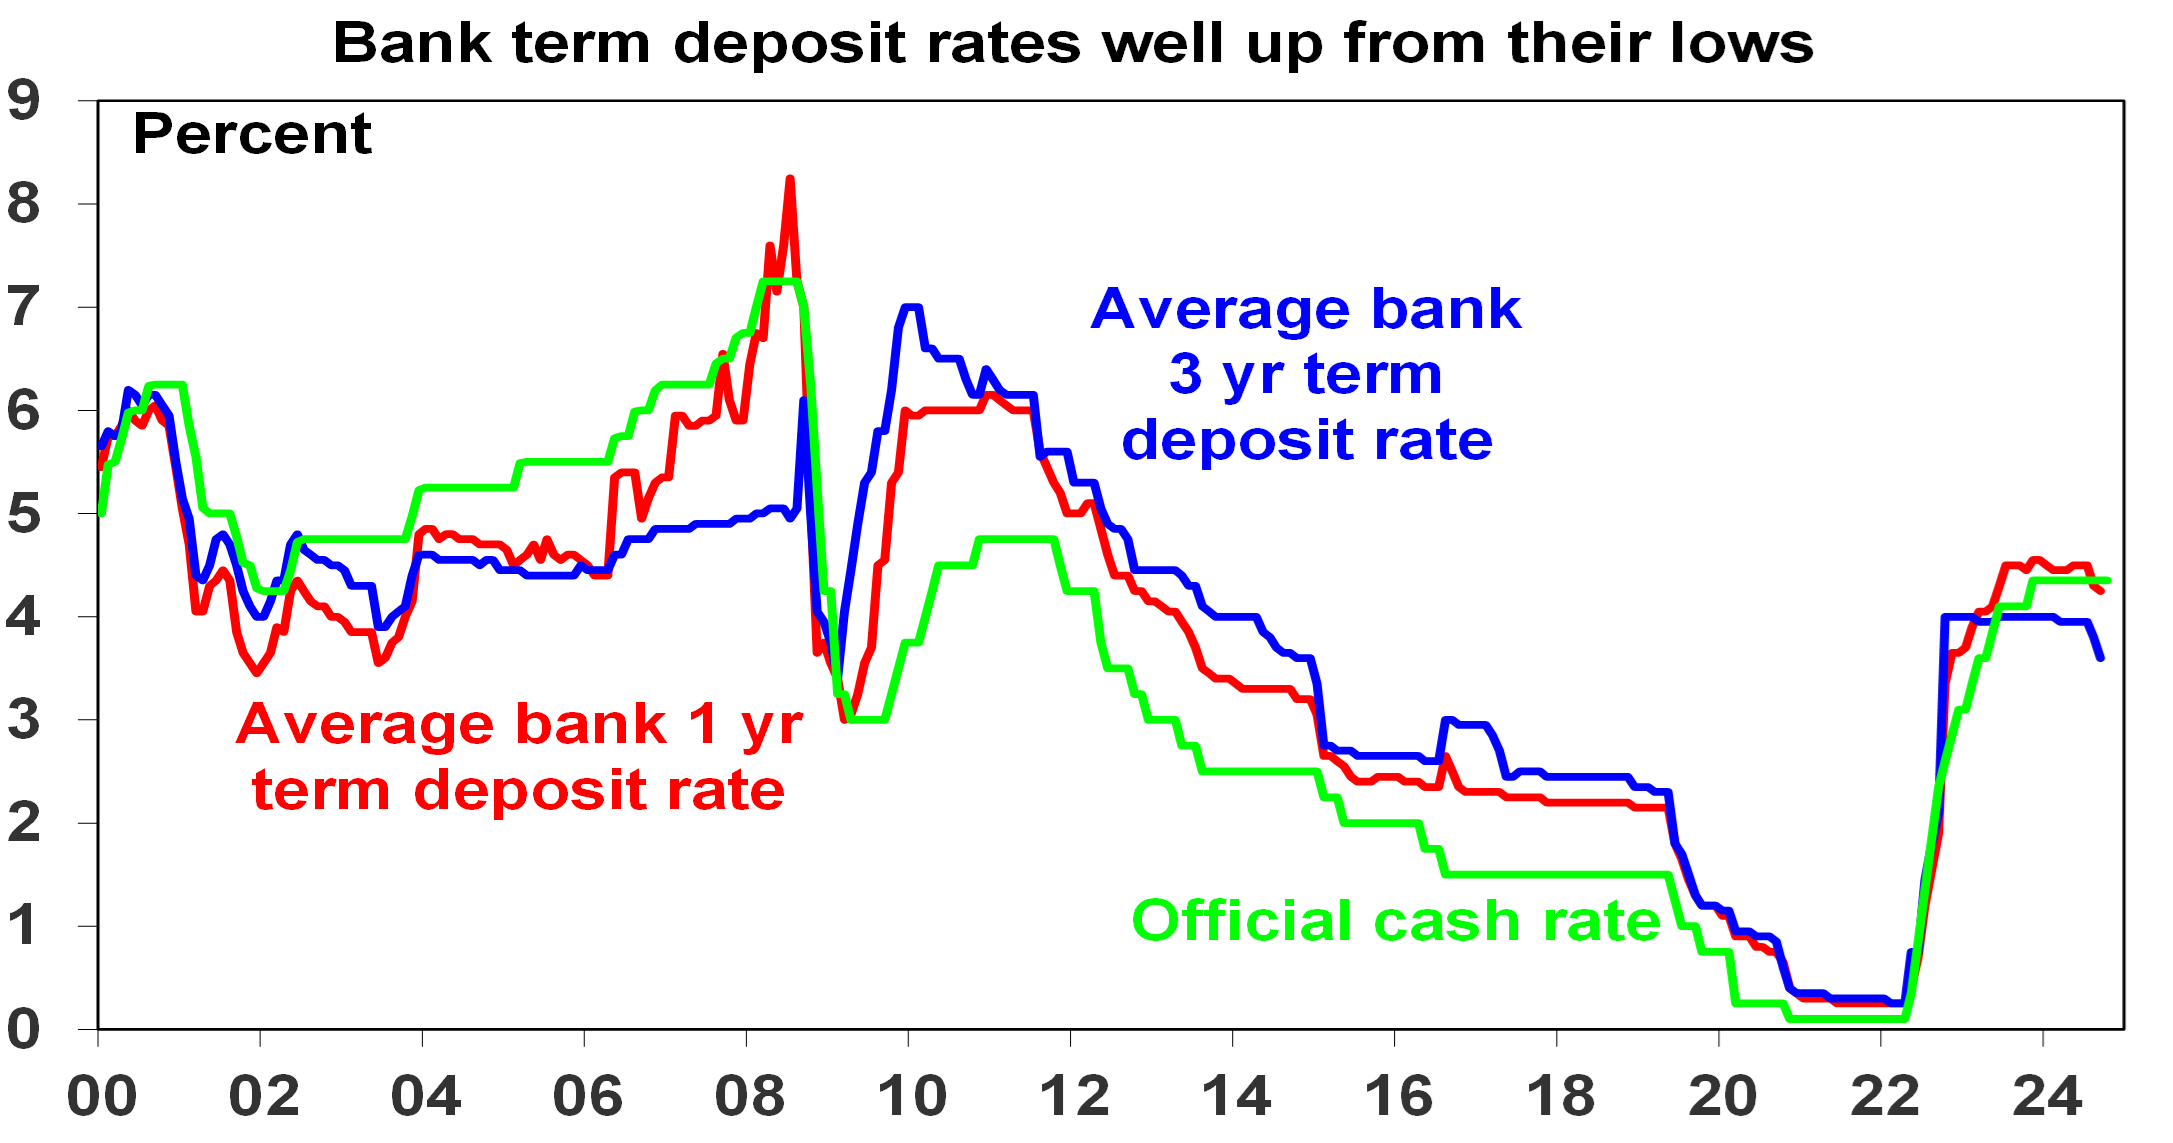
Source: RBA, AMP
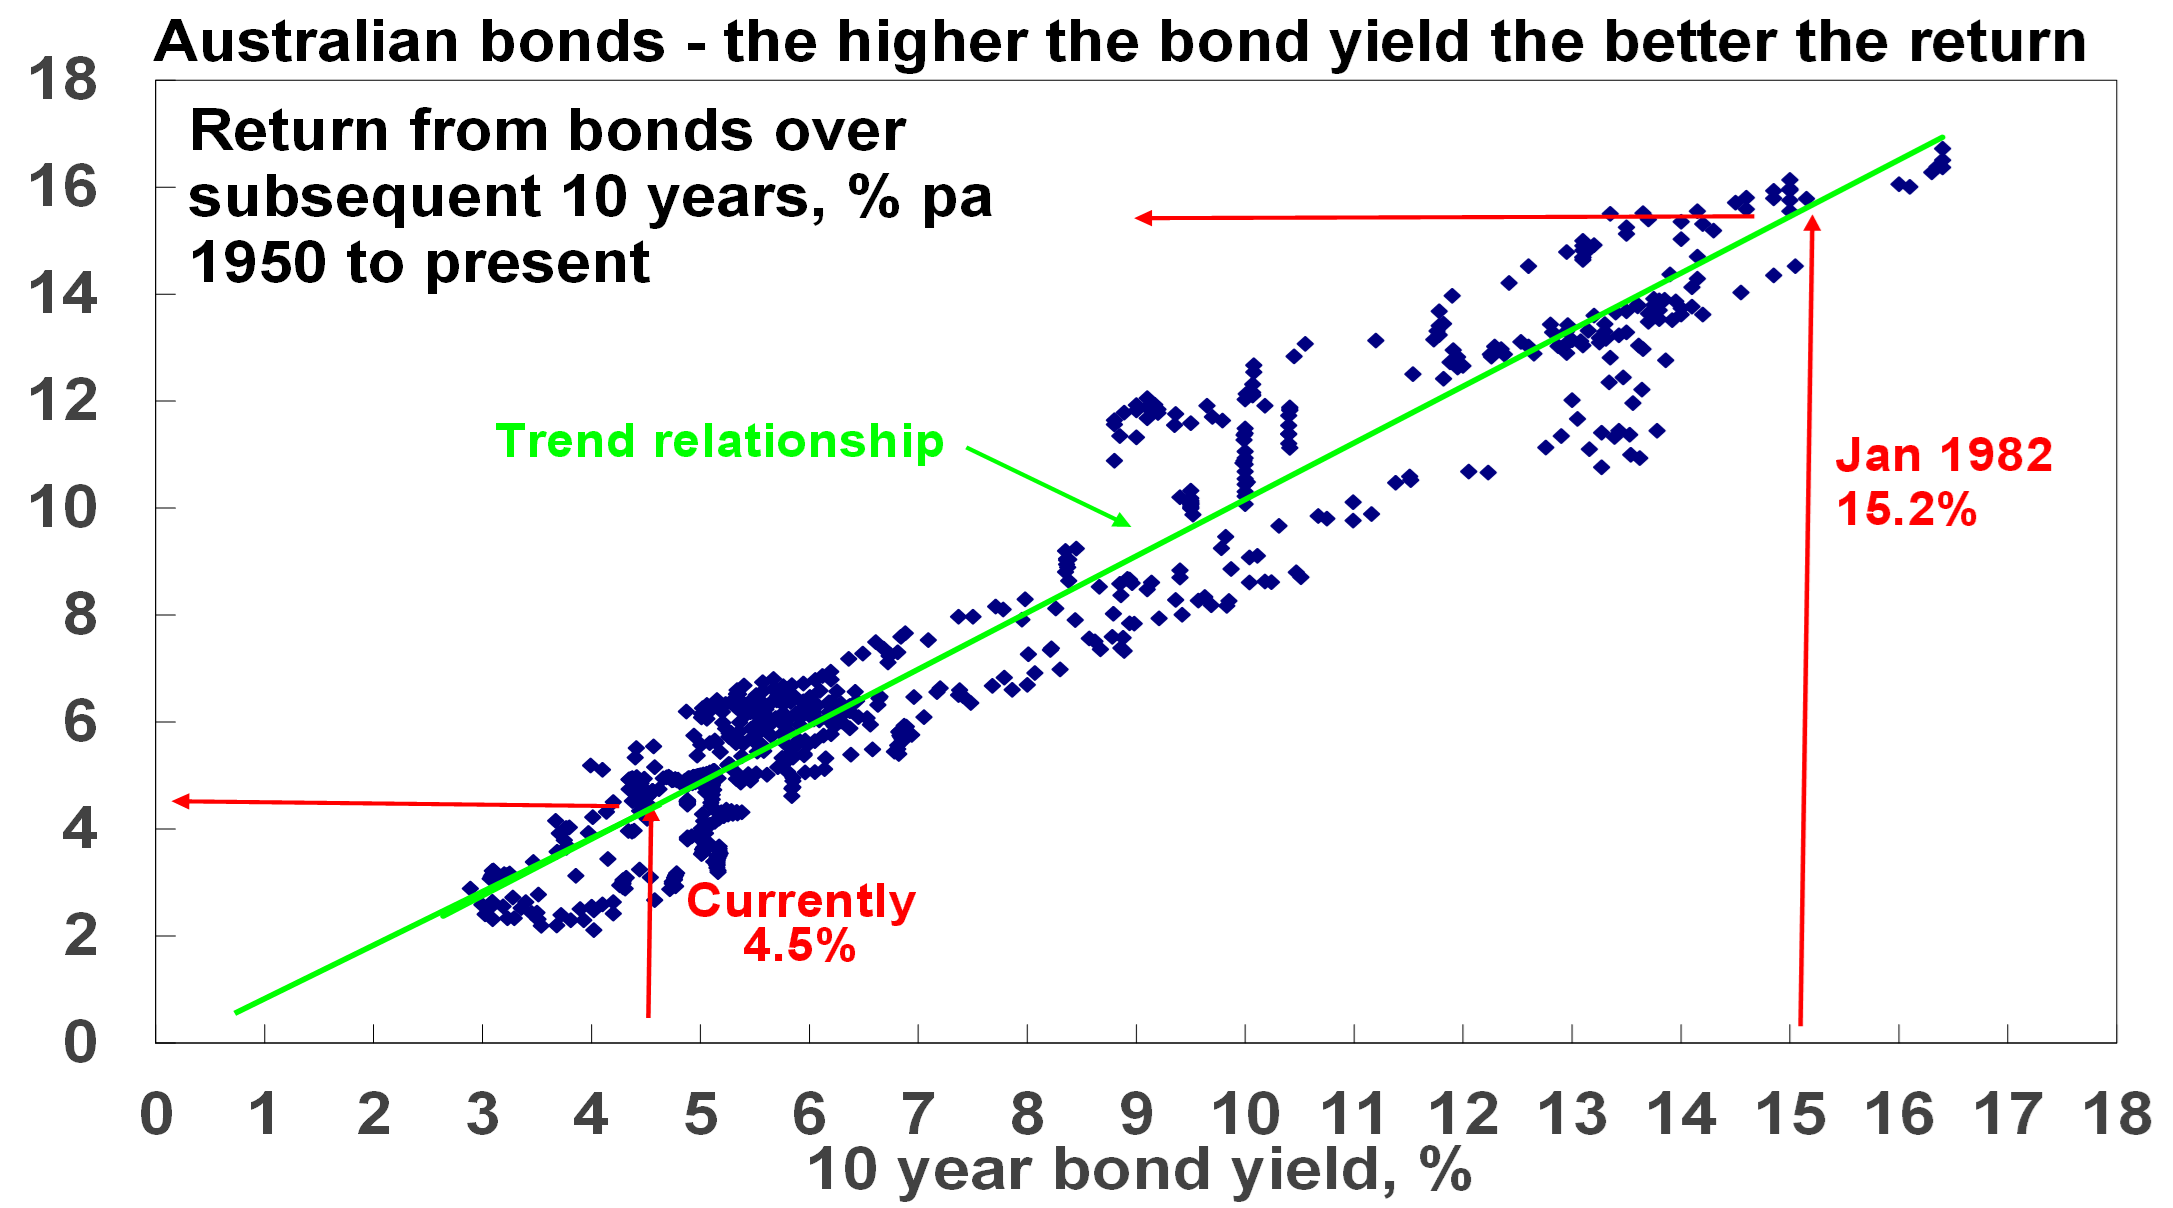
For government bonds, their yield is a good guide to starting point value and hence medium-term return potential. If the yield on a 10-year bond is 5%, and you hold the bond to maturity, your return will be 5%. Of course, the relationship is not perfect but it’s a very good guide. This can be seen in the next chart which shows a scatter plot of Australian 10-year bond yields since 1950 (horizontal axis) against subsequent 10 year returns from Australian bonds based on the Composite All Maturities Bond index (vertical axis). When bond yields are low, they set up low bond returns over the medium term and vice versa. For example, at their low point of 0.6% in 2020, 10-year bond yields were pointing to very low returns but they are now 4.5% pointing to better returns, albeit still historically low.
Source: Bloomberg, AMP
For shares, the lower the PE (or the higher the dividend yield) the better
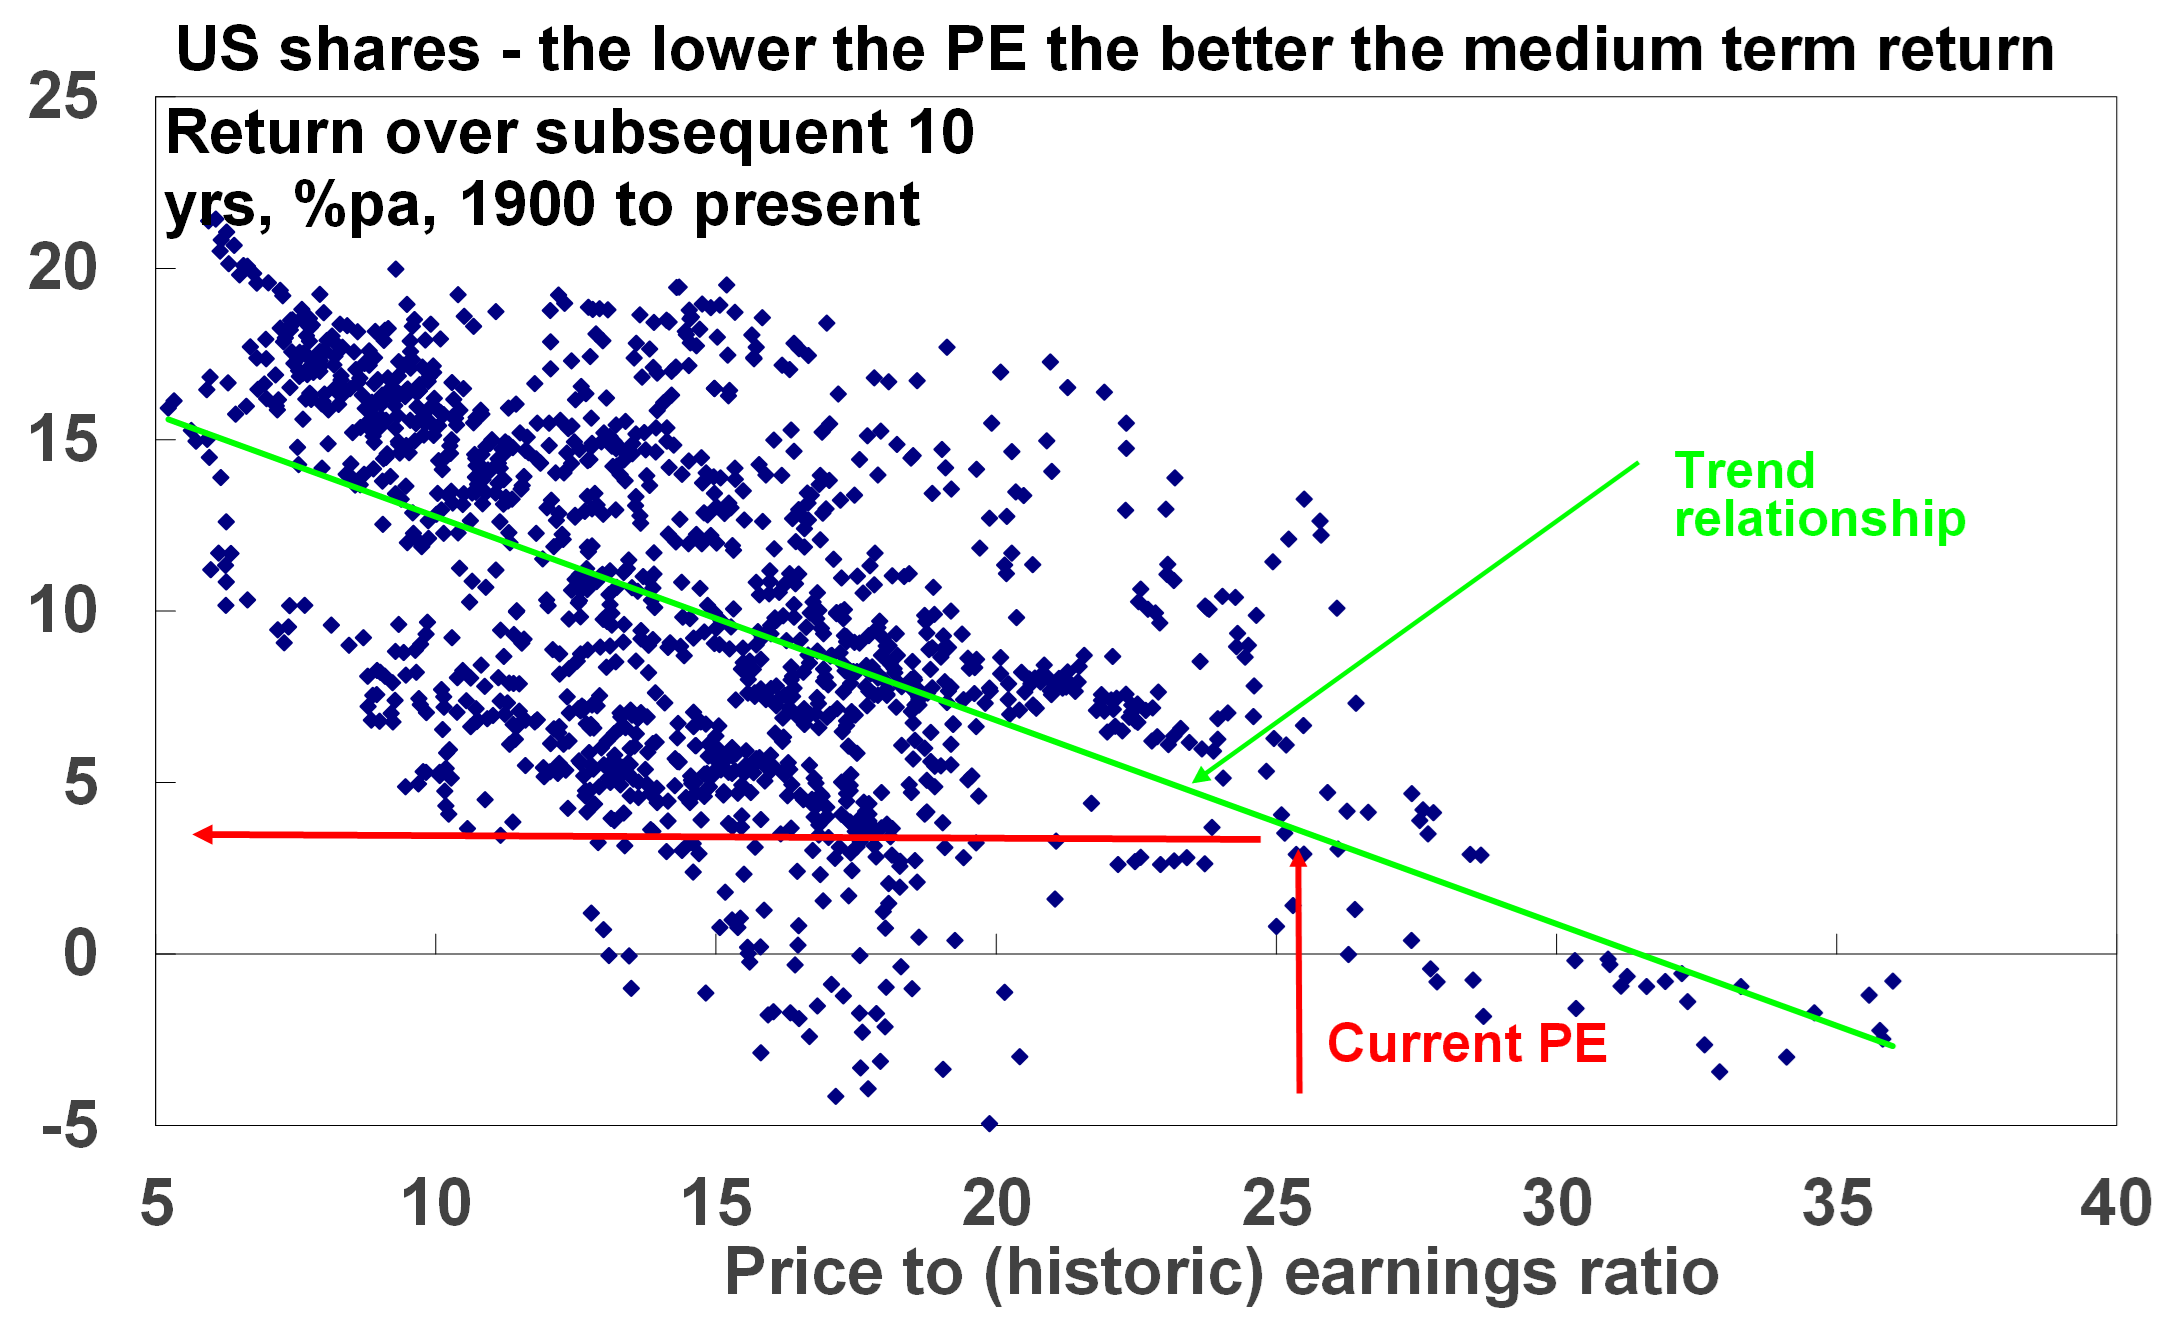
For shares a similar relationship holds. The following chart shows a scatter plot of the price to trailing 12 months earnings ratio for US shares since 1900 (along the horizontal axis) against subsequent 10-year total returns (i.e. dividends plus capital growth) from US shares. While the relationship is not as smooth as for bonds, as share returns are more complicated, it is a negative relationship. So, when share prices are high compared to earnings, subsequent 10-year returns tend to be low and vice versa.
Source: Bloomberg, AMP
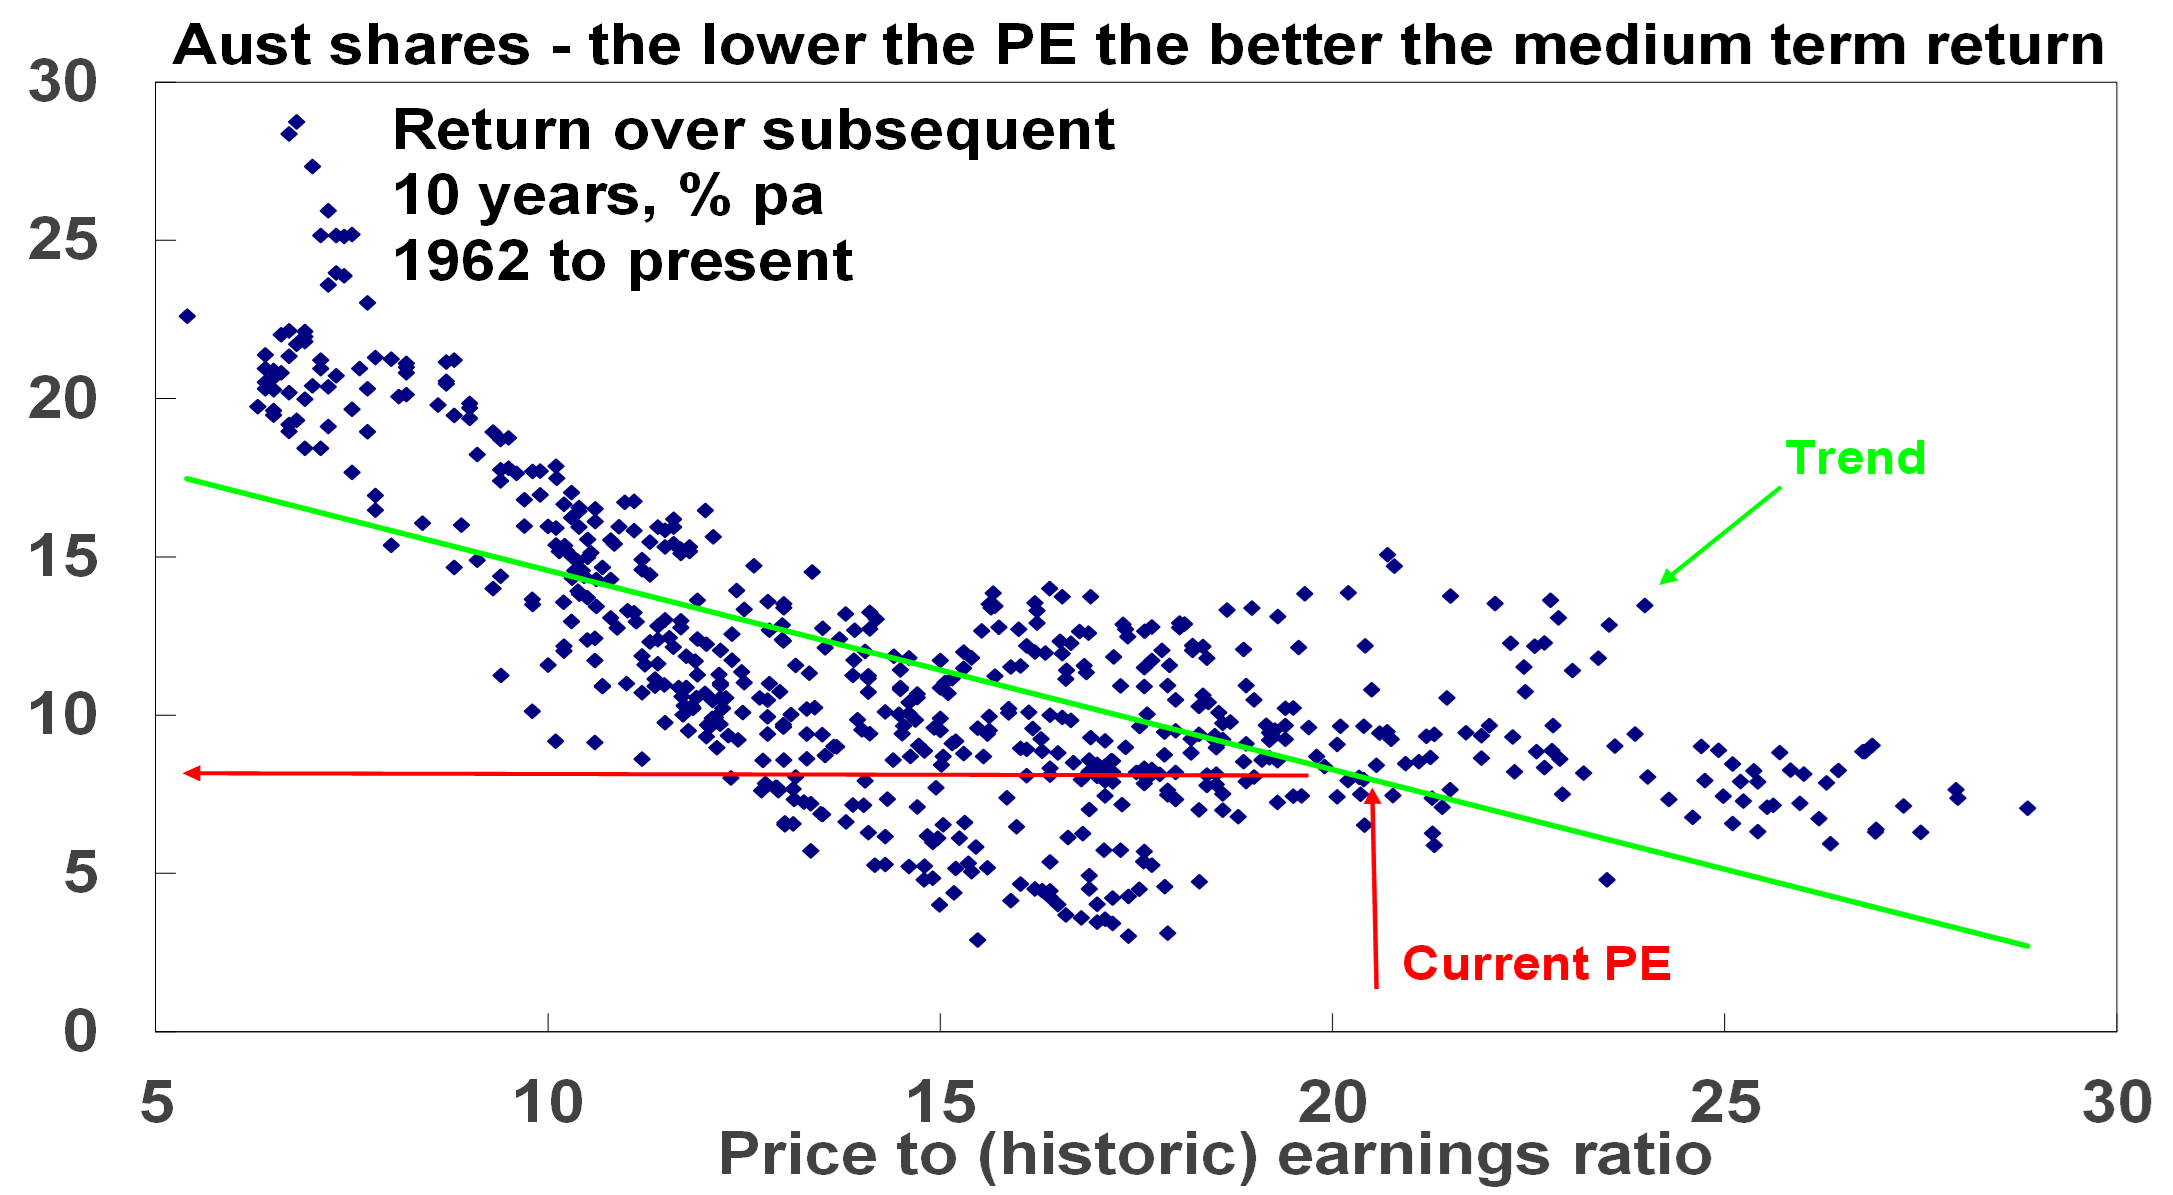
The next chart shows the same for Australian shares from 1962, which is as far back as we have PE data for. Again, the relationship is negative between the level of the PE and subsequent total returns (based on the All Ords Accumulation Index) with the best returns coming after periods of low PEs. For example, at the end of the mid-1970s bear market the PE was just 5.4 times and shares returned 21.8% pa over the next decade!
Source: RBA, ASX, AMP Capital
There is dividend yield data for Australian shares from 1900 and as expected the higher it is the better the subsequent 10-year return.
The key is that the starting point value matters a lot – the higher the yield and the lower the PE (for shares) the better for medium term returns. But behavioural finance tells us that it’s natural for investors to pay too much attention to recent performance, so after a run of strong years investors expect it will continue and fear they will miss out (FOMO) if they don’t get in. This leads many to buy only after good times, only to find they have bought when shares are overvalued, and they find themselves locked into poor returns. And vice versa after a run of poor returns.
Valuation is not a perfect guide to share returns
Of course, share market valuations can have their own pitfalls.
- First, you need to allow for risk as sometimes assets are cheap for a reason. This can be an issue with individual shares, e.g. a tobacco company subject to lawsuits even though current earnings are fine.
- Second, valuation is a poor guide to market timing, often being out by years. Eg, many have pointed out over the last few years that US tech shares are overvalued only to see them keep outperforming.
- Third, there is a huge array of valuation measures for shares. For example, the “earnings” in the PE can be actual historic earnings as reported for the last 12 months, consensus earnings for the year ahead or earnings that have been smoothed to remove cyclical distortions. All have pros and cons.
- Finally, the appropriate level of valuation will vary with inflation and interest rates. In times of low inflation, assets can trade on lower yields as the yield structure in the economy falls, uncertainty falls and (for shares) the quality of reported earnings improves. This means higher PEs. The shift from the high inflation and interest rates of the 1970s and 1980s to very low inflation last decade was very positive for shares. But if inflation rises resulting in higher interest rates, this is bad news for shares as we saw in 2022. Fortunately, inflation is now on the way back down again allowing higher PEs.
Current share market valuation signals
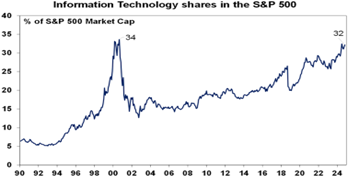
It’s hard to avoid the conclusion that rich valuations point to a period of lower returns over the next decade or so for US shares. This is evident in the relationship between PEs and subsequent share market returns seen in the third chart in this note – with the current US PE of 26 times pointing to an average return over the next decade of around 3% pa – see the red lines on the chart (although there’s been a big range around this). US share market concentration in IT is a concern as the Goldman Sachs analysis pointed out. IT shares are now nearly as big a share of the US market as they were at the tech boom peak in 2000. This is a concern as it’s hard for a handful of stocks to sustain their strong profit performance. That said at least tech stocks are earning strong profits now – with Nasdaq on a 41 times PE versus around 100 in early 2000.
Source: Bloomberg, AMP
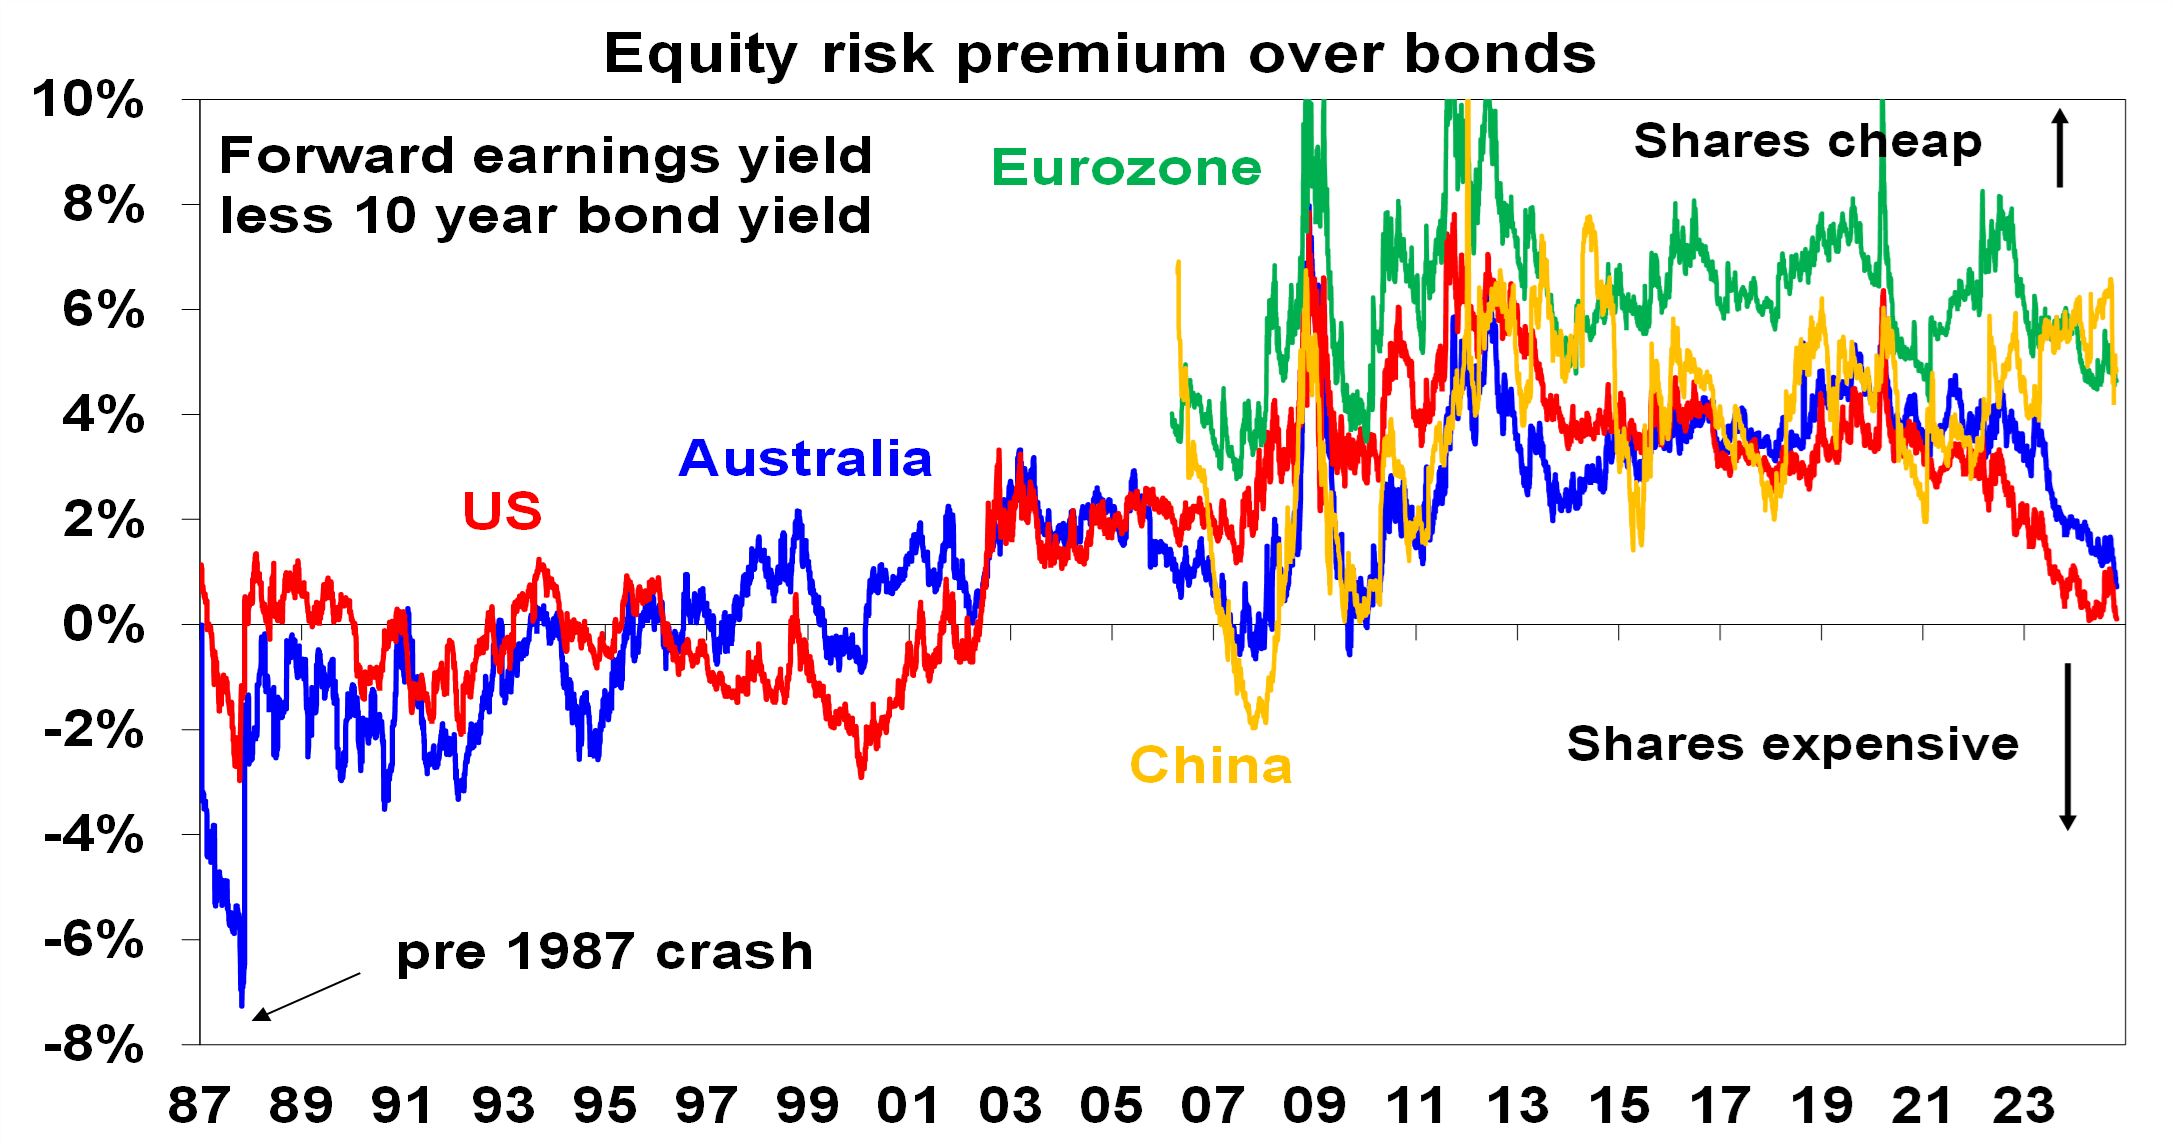
Similarly, the risk premium the US share market offers over bonds – derived by subtracting the 10-year bond yield from the earnings yield (using forward earnings) – is now zero, which is well below the 3 to 4% offered over much of the period since the GFC.
Source: Bloomberg, AMP
Fortunately, valuations for other share markets are not as stretched:
- Australian shares are trading on a PE of 21 times which based on the historic relationship with returns seen in the fourth chart in this note points to a medium-term return of around 8% pa. That said, like the US it offers a relatively low risk premium over bonds (see chart above)
- Eurozone shares are trading on a PE of around 15 times and offer a 4.6% risk premium over German bonds (see chart above).
- Chinese shares are trading on a PE of around 16 times (and lower depending on the index used) and provide a relatively high risk premium over bonds (see chart above).
Implications for investors
Stretched US market valuations have several implications for investors.
First, they leave shares vulnerable to a fall particularly given that the risk of recession still remains high, the expansion of the war in the Middle East still threatens to impact oil supplies (although Israel’s “restrained” response to Iran’s missile attack points to de-escalation for now) and a Trump victory in the US election will likely spark another trade war.
Second, it provides a reminder that share market returns won’t be sustained at double digit levels indefinitely.
Third, given the relatively stretched nature of the US share market and tech stocks in particular there is a case to consider a reduced allocation to US shares in global share portfolios.
Finally, it’s worth bearing in mind that timing this is likely to be hard. Worries about the US share market’s dependence on tech stocks are not new and they have kept going for longer than many thought.
Our view remains positive for shares on a six to 12 month view as central banks cut rates and recession is avoided, but stretched valuations in the key US share market point to more constrained returns with higher risk.
RIFT Raises €11 Million for Decarbonized Industrial Heat Solution

ESG Today|Posted 29/10/2024
Netherlands-based cleantech startup RIFT announced that it had raised €11 million (USD $11.9 million) in Series A funding aimed at advancing its technology to decarbonize industrial heat.
Industrial heating uses high amounts of energy, often from fossil fuel-based sources, in order to transform materials into products such as metals and plastics. While solutions to replace fossil-based energy sources have emerged, including renewable energy, electrification and hydrogen, many are not available at scale for industrial use due to current grid limitations.
Founded in 2020, RIFT provides Iron Fuel Technology, which operates like a rechargeable battery for heat generation, as a solution to help decarbonize industrial heat. The solution’s self-enclosed system burns iron powder in a boiler, creating heat at varying temperatures, producing hot water, steam, or hot air in a process that avoids direct CO2 emissions and maintains ultra-low NOx emissions.
RIFT believes that its system will decarbonize industrial heat, reducing 1 Gigaton of CO₂ annually from 2050 onwards. A test program in the Netherlands community of Helmond saw the system heat 500 households in 2022 and 2023, with minimal amounts of CO2 emissions measured, according to the company.
The company said that the new capital will be used to complete durability tests and finalize initial commercial contracts of its iron-powder-based renewable heating system.
Investors in the funding round include PGGM (on behalf of PFZW), Invest-NL, and Oost NL, who joined existing shareholders Rubio Impact Ventures, the Energy Transition Fund Rotterdam, and Brabant Development Agency (BOM).
RIFT CEO and Co-founder Mark Verhagen said:
“We have engaged a strong consortium of both public and private parties who not only provide us with capital but also crucial knowledge and experience in sustainable value chains and infrastructures. This is essential for large-scale implementation and allows us to complete the final testing phases for commercial application. This collaboration increases our chances of a successful rollout and brings us one step closer to our ambition of reducing global emissions by one gigaton per year by 2050. We are ready to make a tangible impact in the industry.”
Remco Westerbeek, investment manager at Invest-NL, added:
“RIFT offers an innovative, sustainable alternative for industrial heat, a sector that is one of the world’s largest sources of greenhouse gas emissions and difficult to decarbonize. RIFT’s Iron Fuel Technology can help companies reduce their CO2 emissions without requiring extensive infrastructure changes. This investment aligns perfectly with Invest-NL’s mission to support innovative solutions that accelerate the energy transition.”
Regards,
JMP Securities Team
JMP Securities
a. Level 3, ADF Haus, Musgrave St., Port Moresby NCD Papua New Guinea
p. PO Box 2064, Port Moresby NCD Papua New Guinea
Email: lars.mortensen@jmpmarkets.com
Ph: +675 7200 2233
Mobile: +675 7056 5124
Email: nathan.chang@jmpmarkets.com
Ph: +675 7167 3223
Mobile: +61 422 113 630