24 June, 2024
Hello and welcome to this week’s JMP Report,
On the equity front last week we saw 4 stocks trade on the local market. BSP traded 1,544 shares, closing 17t higher at K17.16, KSL traded 503,910, closing 4t higher at K3.05, STO traded 317 shares, closing steady at K19.38 and KAM traded 1,500 shares also steady at K1.25.
WEEKLY MARKET REPORT | 16 June, 2024 – 20 June, 2024
| STOCK | QUANTITY | CLOSING PRICE | BID | OFFER | CHANGE | % CHANGE | 2024 INTERIM | 2024 FINAL DIV | YIELD % | EX-DATE | RECORD DATE | PAYMENT DATE | DRP |
| BSP | 1,544 | 17.16 | 16.99 | – | 0.17 | 0.99 | K0.370 | K1.060 | 8.87 | TUE 27 FEB 2024 | WED 28 FEB 2024 | FRI 22 MAR 2024 | NO |
| KSL | 503,910 | 3.05 | 3.05 | – | 0.04 | 1.31 | K0.097 | K0.159 | 8.82 | TUE 4 MAR 2024 | WED 6 MAR 2024 | MON 15 APR 2024 | YES |
| STO | 317 | 19.38 | 19.38 | – | – | 0.00 | K0.314 | K0.660 | 5.04 | MON 26 FEB 2024 | TUE 27 FEB 2024 | TUE 26 MAR 2024 | – |
| NEM | – | 145.00 | 145.00 | – | – | 0.00 | – | USD 0.250 | 0.63 | MON 4 MAR 2024 | TUE 5 MAR 2024 | WED 27 MAR 2024 | – |
| KAM | 1,500 | 1.25 | 1.16 | – | – | 0.00 | K0.12 | – | – | – | – | – | YES |
| NGP | – | 0.70 | – | – | – | 0.00 | K0.03 | – | – | – | – | – | – |
| CCP | – | 2.16 | 2.13 | – | – | 0.00 | K0.110 | K0.131 | 6.21 | FRI 22 MAR 2024 | WED 27 MAR 2024 | FRI 19 APR 2024 | NO |
| CPL | – | 0.79 | – | 0.79 | – | 0.00 | – | – | – | – | – | – | – |
| SST | – | 48.00 | – | 50.00 | 3.00 | 6.00 | K0.35 | K0.60* | 1.33 | WED 24 APR 2024 | FRI 26 APR 2024 | FRI 26 JULY 2024 | NO |
Dual Listed PNGX/ASX Stocks
BFL – 6.45 -10c
KSL – 94c -2.5c
NEM – 63.27 +2.42
STO – +.095
Interest Rates
In the 7 day CBB Market the Bank took 2.13bn in bids of the system, there was approx. 2.3bn in maturities which will leave approx. 139mill of liquidity in the market. In the 364 day TBills we saw the market weaken further with the auction average at 4.16%. up 12bpts from the week before. The Bank offered 146mill, received 130mill in bids and the Bank issued 130mill. Expect to see further weakness this week.
The results from the GIS tender last week was quite bearish with little interest in the 5yr to 10yr maturities. This leaves quite an issue for Treasury as the GIS auctions to date are approx. 970mill behind budget. This week’s auction saw 500mill offered, received 267mill in bids and was undersubscribed by 370mill.
GIS Results;
2yr 4.4%
3yr 4.60%
5yr 4.70%
6yr 5.10%
7yr 5.40%
8 yr 5.5%
9yr 5.7%
10yr 5.9%
Look at the spread across the yield curve and ask yourself, is it worth picking up 1.50% between 2yr and 10yr Government Debt Risk? No, best to bid a bit high in the 2y and 3yr, if you miss out, you will be picking up 4.20% to 4.40% in the 364day TBill shortly. Risk versus reward. The long end rates have only one direction now, market bids will drift out to much higher levels in the remaining 2024 auctions.
Other Assets we like to monitor
Gold – 2321
Palladium – 959
Platinum – 992
Silver – 29.50
Bitcoin – 63,204 – -4.60%
Ethereum – 3418 – -4.17%
What we have been reading
Private Equity Buys In Renewable Energy Big Time, Almost $15B
By Jennifer L
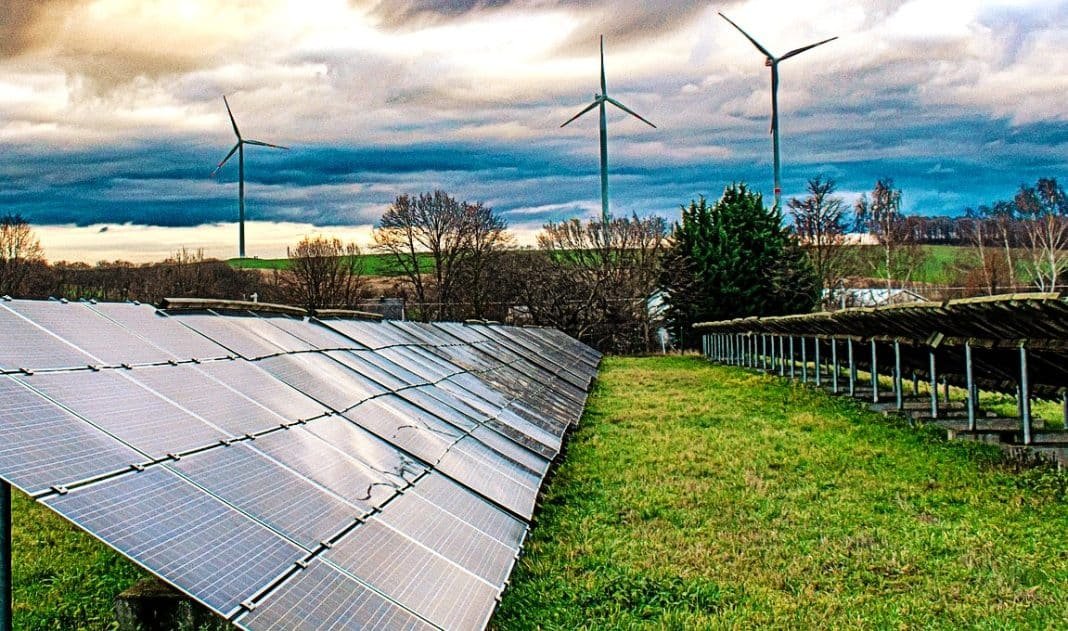
The world is rapidly shifting towards clean renewable energy solutions, driven by their immense potential to mitigate climate change and achieve global net zero targets. Surprisingly, private equity firms are at the forefront of this trend, investing heavily in solar, wind, biomass, and other renewables.
These firms are drawn not only by the social and humanitarian benefits but also by the economic advantages of renewables, which include low-cost power, reduced reliance on imported fuels, and a more secure, reliable energy supply.
Private Capital Takes Charge in Renewable Energy Investments
Private capital is experiencing a surge in acquiring renewable energy developers, increasingly favoring equity-based take-private deals for leveraged buyouts due to high interest rates and rising electricity demand.
The statistics underscore this movement. In 2023, private equity and venture capital transactions in the global renewable energy sector nearly reached $15 billion. This is the highest total in the past five years, according to S&P Global Market Intelligence data.
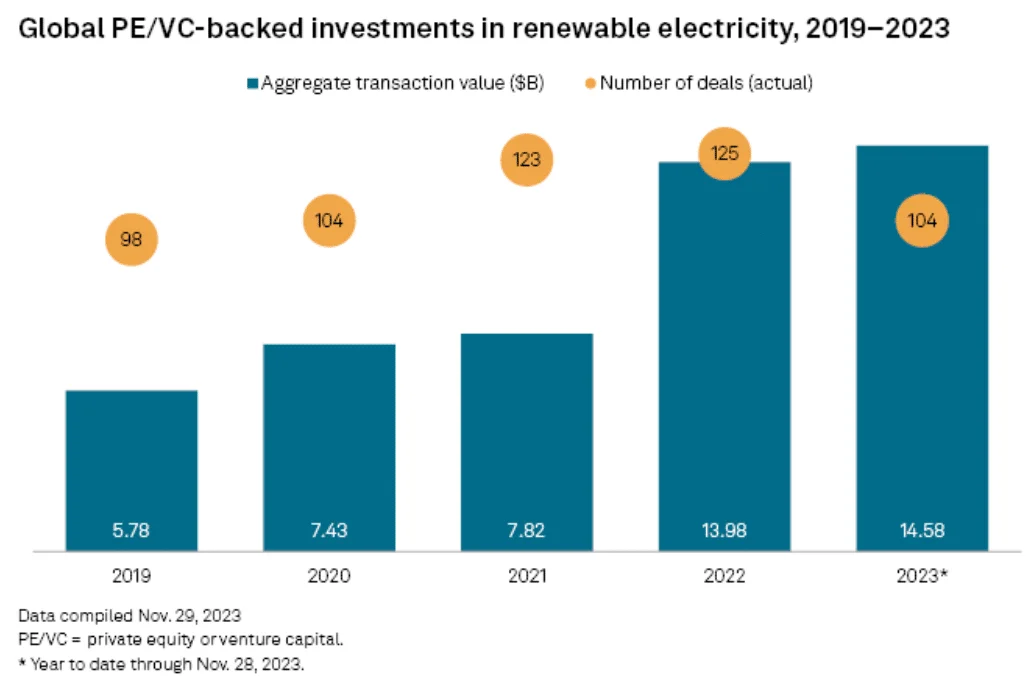
Source: S&P Global Market Intelligence
Moreover, funds raised for renewable energy projects in recent years are approaching 25 times the value of fossil fuel asset fundraising, per another industry report. This significant financial commitment highlights the growing recognition of the economic viability and long-term benefits of renewable energy investments.
Key investors such as KKR & Co. Inc., Brookfield Asset Management Ltd., EQT AB, and Energy Capital Partners LLC have actively bid for listed renewable platforms this year, aiming to accelerate the companies’ installed capacity in the coming years.
After a period of limited dealmaking activity, asset managers and infrastructure funds are now leveraging their project development skills as they grow more comfortable with the renewable energy sector. Brookfield Renewable Partners, for instance, has a strong track record of acquiring developers with significant pipelines in the US.
Peter Zhu, managing director at Macquarie Group Ltd.’s Green Investment Group, highlighted that the current higher interest rate environment has adjusted equity returns for renewables favorably, creating an attractive investment window for leading renewable platforms.
Last month, private equity firm EQT offered offered to acquire Swedish renewable energy company OX2 for $1.5 billion. The goal is to enhance EQT’s renewable energy portfolio and boost OX2’s growth in the energy sector.
This shift indicates a strategic pivot in private capital investment, focusing on the long-term potential and growth capabilities of renewable energy developers.
Challenges and Opportunities in Renewable Energy Valuations
The renewable energy sector has faced substantial challenges in recent years, including project delays, trade restrictions, supply chain disruptions, and rising interest rates, affecting both US and European developers. These obstacles have negatively impacted the valuation of publicly traded renewable energy companies.
- For instance, within Bloomberg Intelligence’s renewables peer group—which includes Brookfield target Neoen SA and KKR target Encavis AG—the enterprise-value-to-capacity multiple has declined from 1.5x in January 2023 to 1.1x.
A notable example is Sweden’s OX2 AB, whose stock price dropped by 24% in 2024 before EQT AB made a $1.5 billion offer on May 13.
According to experts, the current market conditions have made the valuations of these publicly traded renewable power developers more attractive for investors. They highlighted that the previous combination of rapid growth in renewable power and low interest rates created opportunities for private capital to acquire renewable developers at more favorable prices.

Data centers are a significant driver of growth in the renewable energy sector. KKR’s $3 billion bid for Germany’s Encavis includes a commitment to increase the company’s installed capacity to 7 GW by the end of 2027, up from the previous target of 5.8 GW.
Similarly, Brookfield has expressed intentions to “accelerate [Neoen’s] growth,” reflecting a broader trend among investment giants to enhance the capabilities of renewable energy developers they acquire.
- READ MORE:Brookfield’s Renewable Solutions to Power Data Centers
The Nordic market, particularly suited for data centers, is poised for growth due to the substantial power demands associated with data center development.
Brookfield recently entered into a global 10.5-GW framework agreement with Microsoft, a deal nearly 8x larger than the largest single corporate PPA, underscoring the immense demand from hyperscale datacenters and industrial facilities.
Fueling the Exponential Growth in Energy Transition Deals
Energy transition deals involving private equity have surged dramatically over the past five years, with total deal value increasing by 7,300%. In the U.S., private equity-backed energy transition deals grew from less than $500 million in 2018 to more than $25.9 billion in 2023.
In comparison, traditional private equity energy deals only increased by 53%, from $20.9 billion in 2018 to $32.0 billion in 2023. Although still behind, private equity deal flow in the energy transition sector nearly caught up with traditional energy deals over this period.
Non-private equity investors still dominate energy transition deal flow, but their growth, while robust, was less dramatic. The total value of these deals rose by 379%, from $8.9 billion in 2018 to $42.7 billion in 2023.
As for how capital is being deployed, data suggests private equity investing in energy transition is very broad in scope. Remarkably, most of the funds in 2022 and 2023 went to wind, solar, and supporting technologies ($12.8 billion).
![]()
Source: Weaver.com
The significant increase in private equity investments in the energy transition sector could drive these efforts forward.
Private equity firms are increasingly investing in the renewable energy sector, driven by both economic and environmental benefits. Despite challenges like project delays and rising interest rates, the potential for growth in renewable energy remains strong. This surge in private capital is critical for accelerating the global transition to clean energy.
Econosights
Trade war risks with a Trump 2.0 Presidency
Diana Mousina, Deputy Chief Economist, AMP
20 Jun 2024
Key points
– Trump 1.0, COVID-19 and a move to de globalisation has resulted in trade restrictions becoming more common around the world.
– The betting markets for the November election have Trump ahead of Biden by 9 percentage points. Trump 2.0 would result in trade policies that are much larger compared to those imposed in 2018 because he is proposing a 10% across-the-board tariff and a 60% tariff on Chinese imports.
– Sharemarkets had a large negative reaction to Trump’s 2018 trade restrictions.
– Markets are under-pricing the chance of a Trump victory in November and the high risk of a global trade war erupting which would be negative for growth and sharemarkets.
Introduction
We recently wrote about the issues surrounding the US election. In this Econosights we look specifically at Trump’s trade policies, which may result in significant downside risk to sharemarkets, in the event of a Trump 2.0 Presidency in 2025.
A history of recent US trade disputes
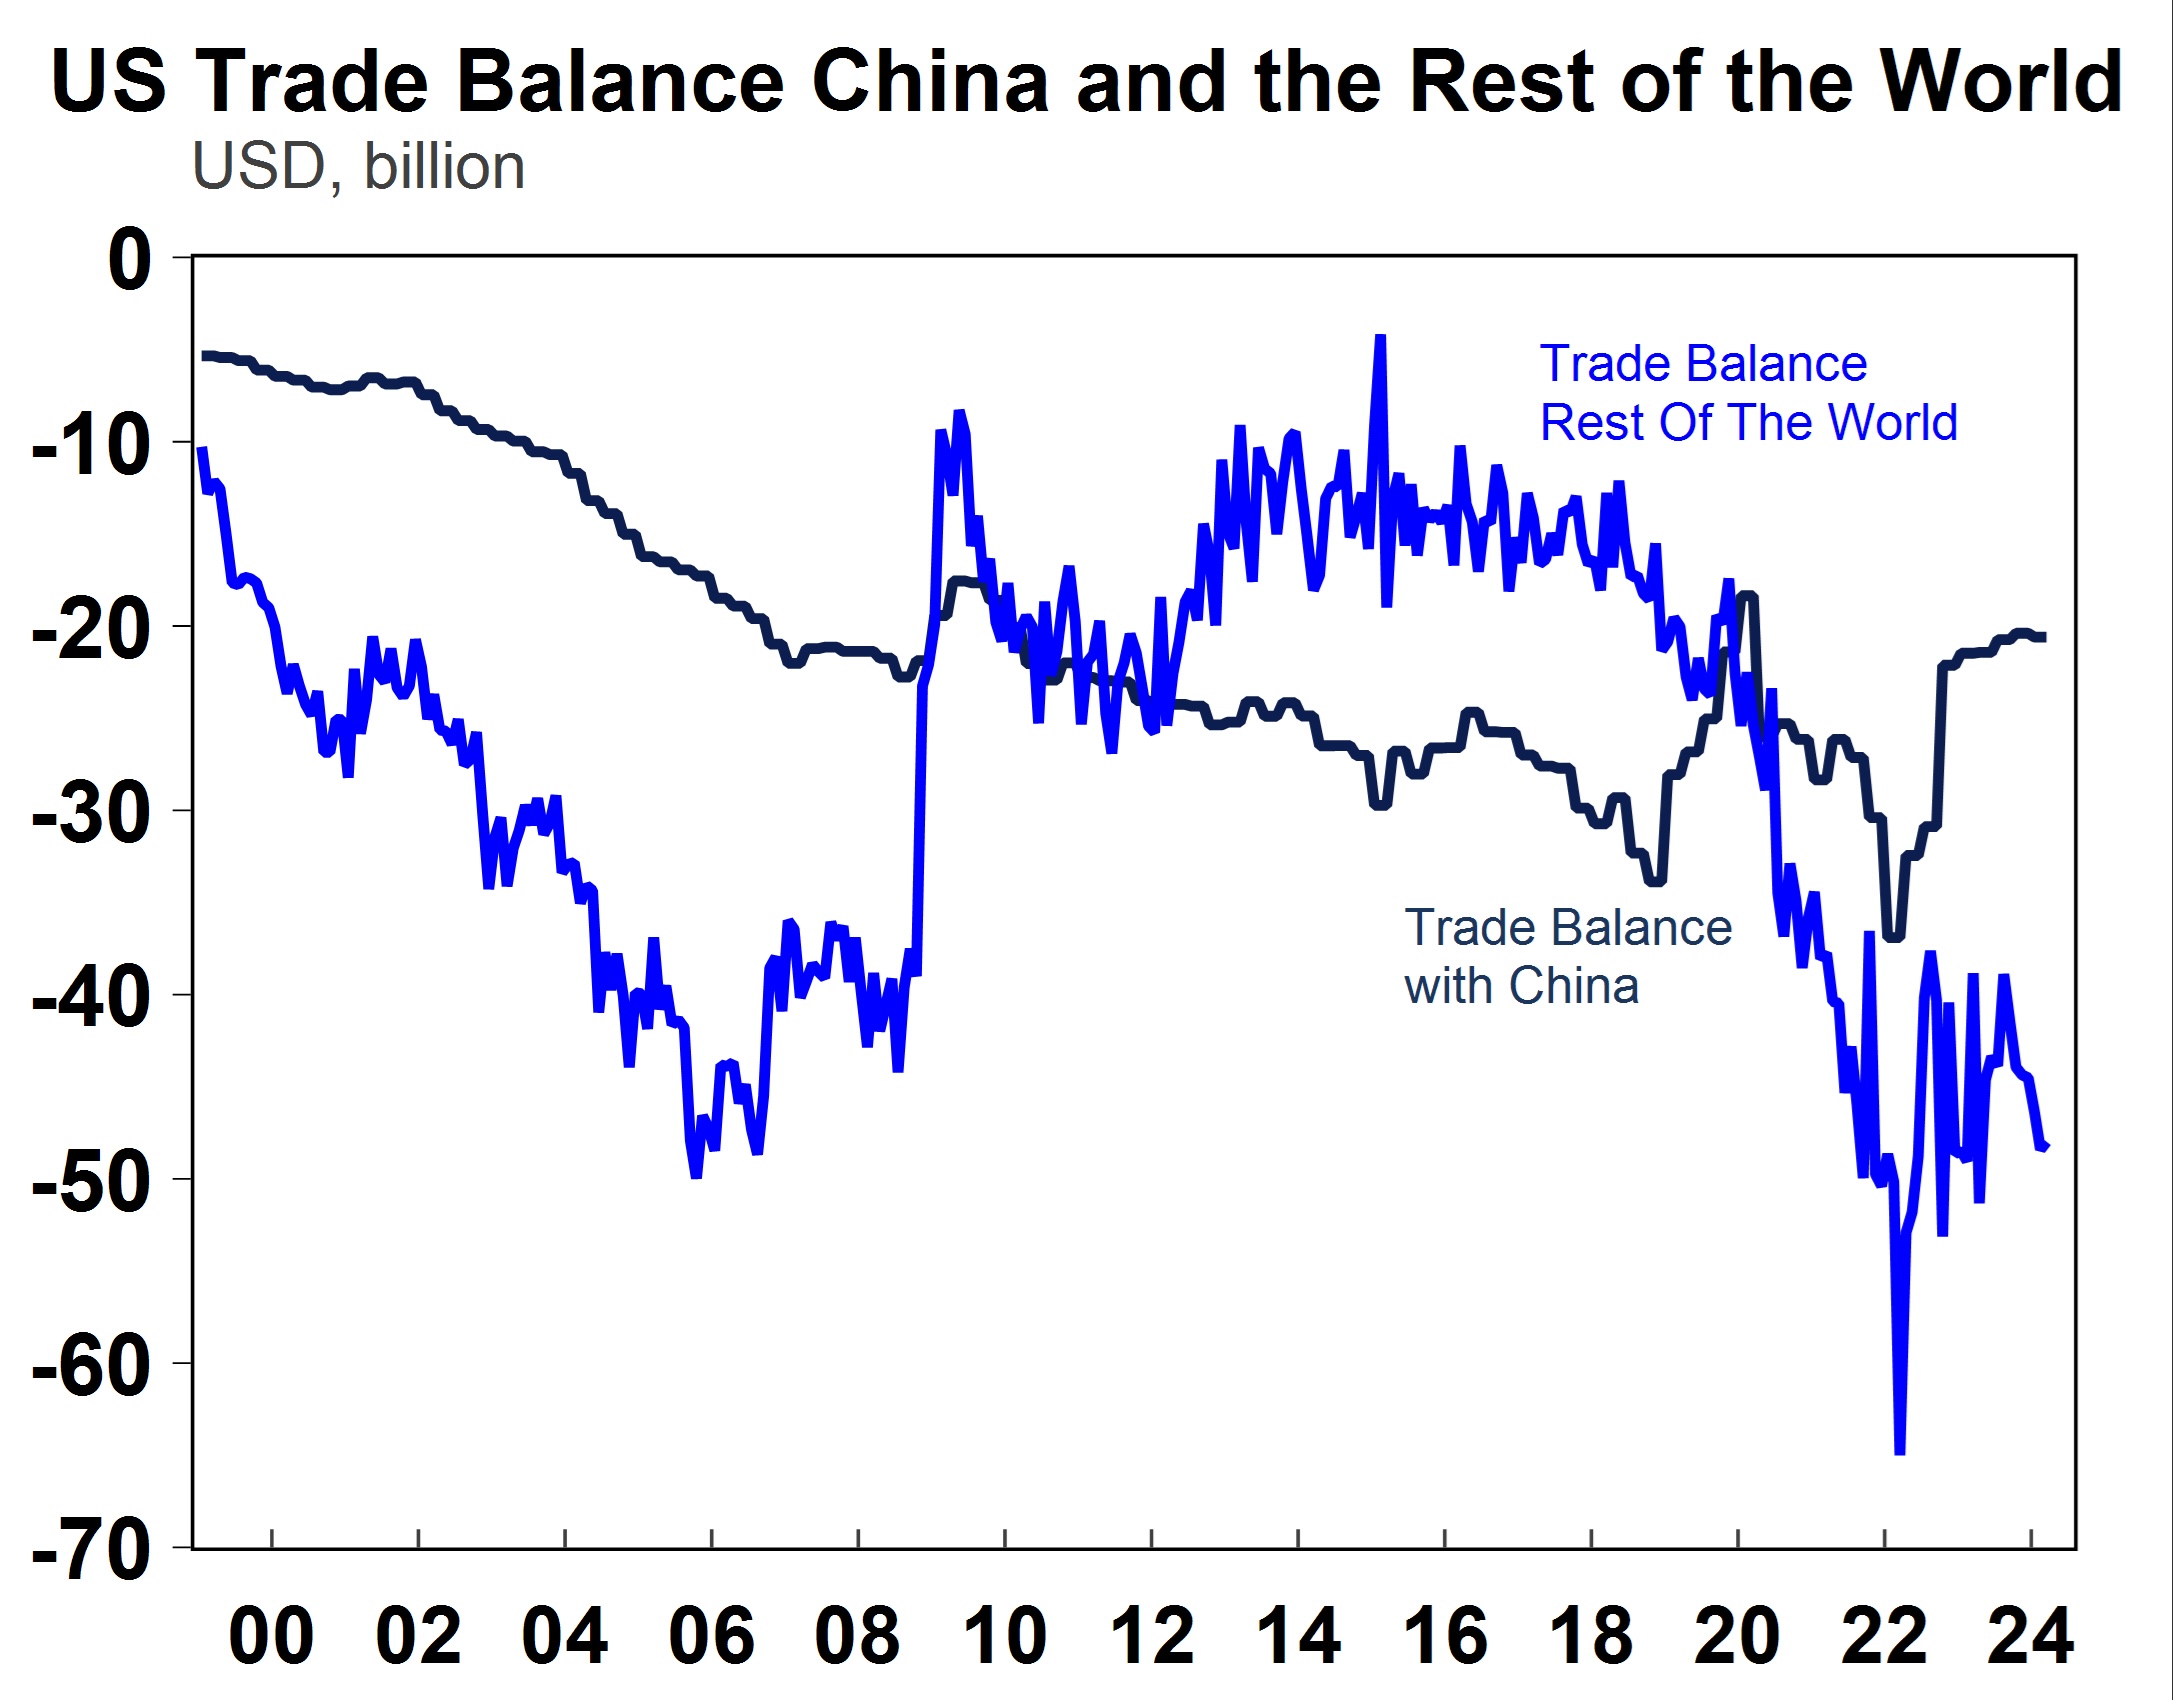
The US runs a trade deficit and has done so since the early 1990s (see the chart below). This means that the value of US imports (both goods and services) is higher than US exports to the world. The Trump 1.0 trade war which started in 2018 was focussed on reducing bilateral trade deficits (directed mostly at China) and set the tone for a more closed global economy, which was then bolstered by COVID-19 pandemic.
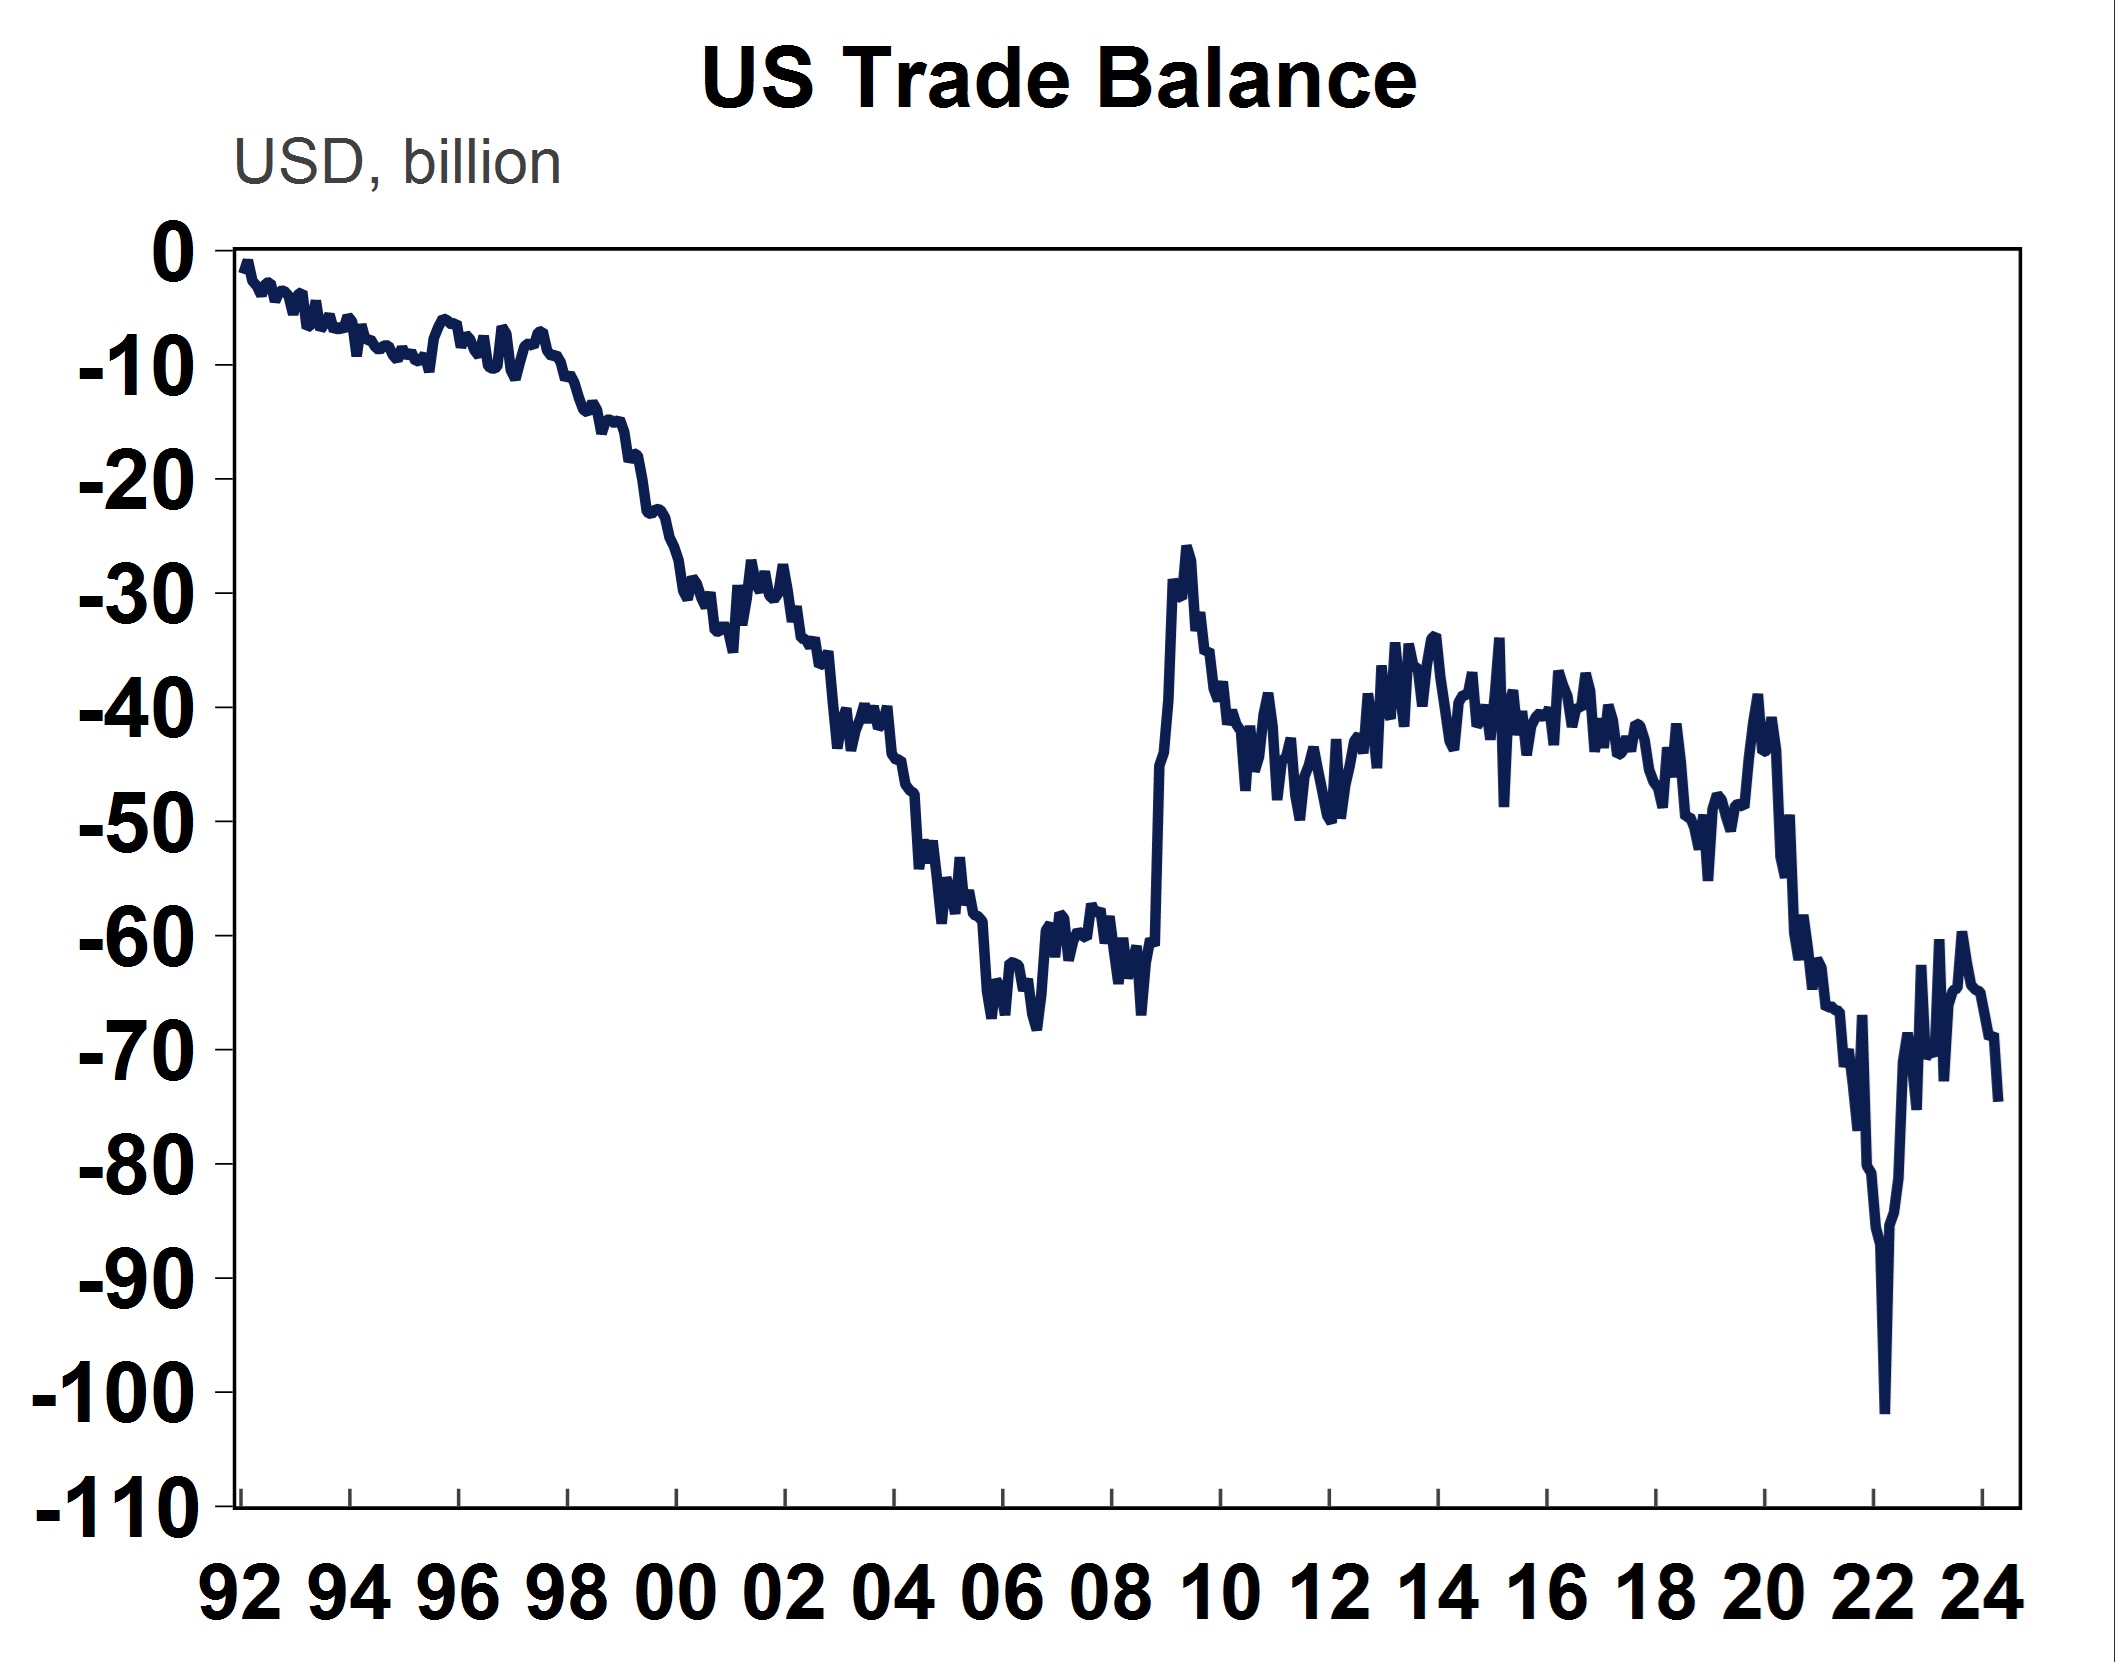
Source: Macrobond, AMP
According to the US Tax Foundation, Trump 1.0 in 2018 levied tariffs on ~$380bn of imports (13% of total imports) including steel and aluminium, washing machines, solar panels. Around 70% of Chinese imports were subject to a tariff (ranging from 7.5% to 25%). Tariffs on European Union goods included aircrafts, agricultural and other products (which have since been suspended by Biden). China and Europe responded with some retaliatory tariffs on items such as US agriculture, although there were some exclusions over time.
Financial markets had a big negative reaction to the Trump 1.0 trade tariffs. The US S&P 500 fell by nearly 16% between March 2018 when the tariffs started in earnest and reached a low in December. At this time, global trade policy uncertainty saw the largest lift on record, or at least since the data started in the mid-1990s (see the chart below). Although, there were other events going on at the same time, including concerns about rising interest rates due to the strength of the US economy which was also negative for sharemarkets.
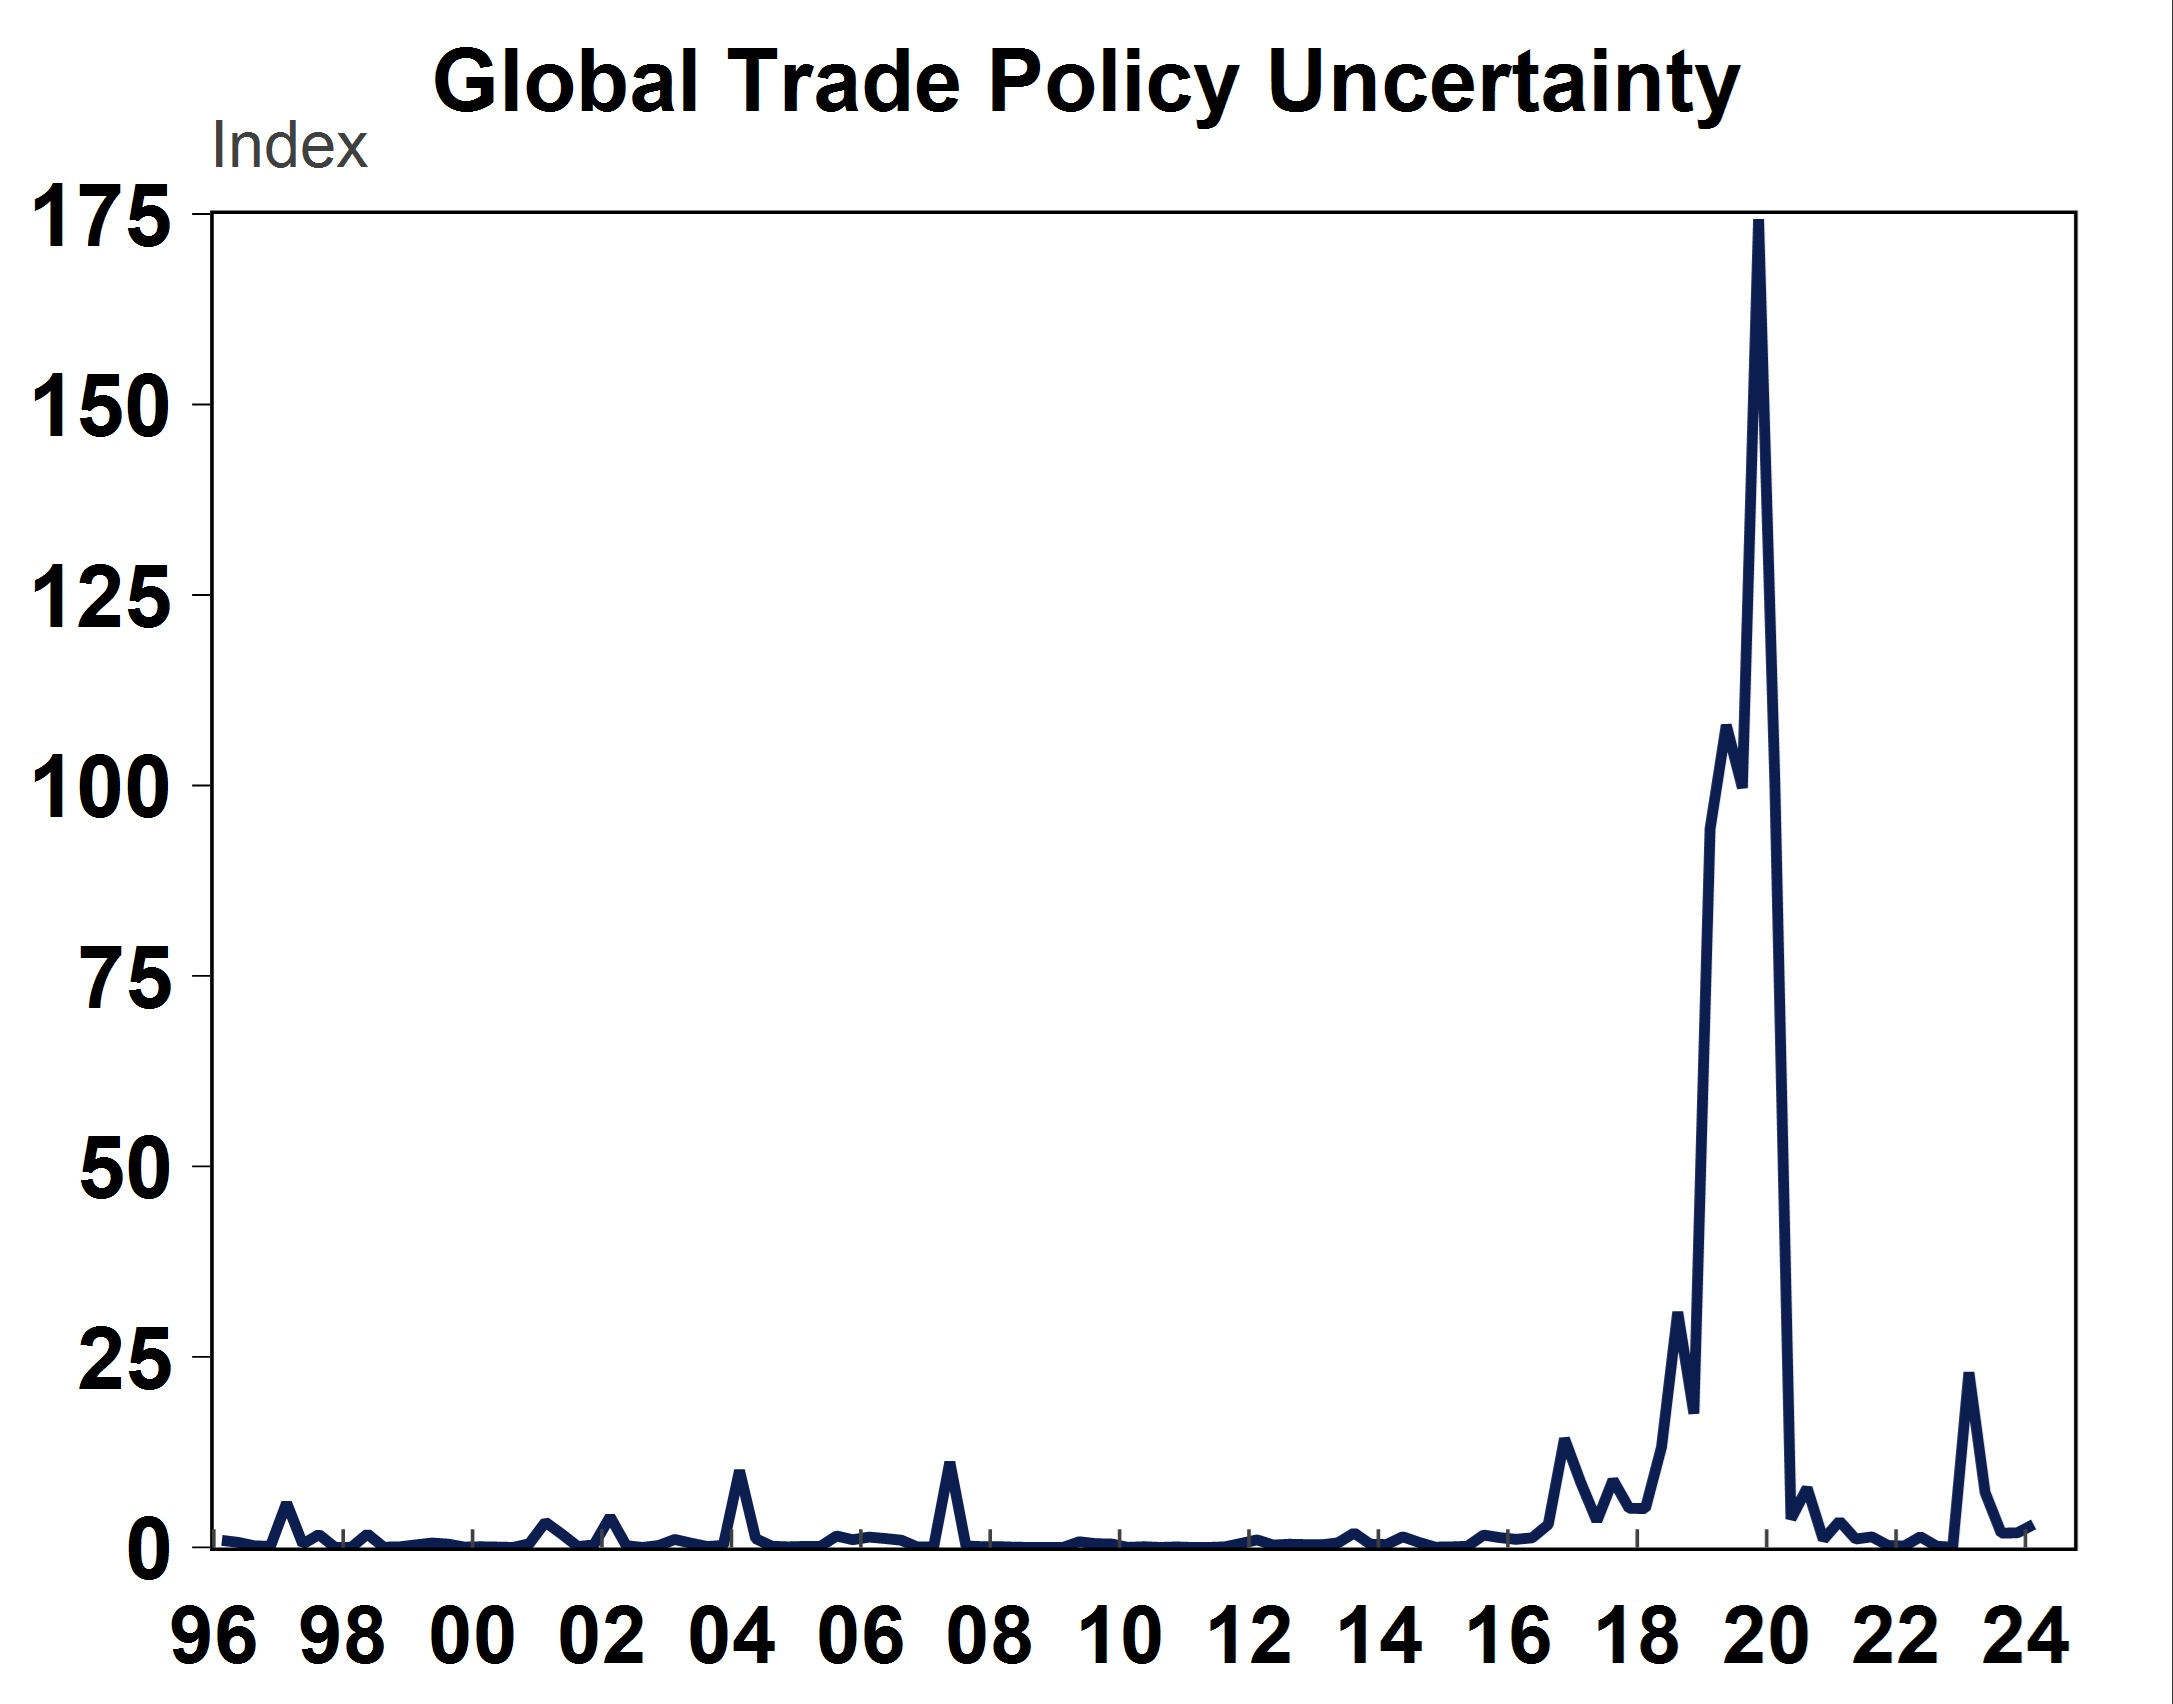
Source: Macrobond, AMP
Since then, President Biden has remained “tough” on China by retaining most of the Trump 1.0 tariffs (with minor exemptions on certain items), blacklisting Chinese officials, investigating banning TikTok and recently increasing tariffs on renewables, semiconductors and health care products, including a 100% tariff on electric vehicles (up from 25%).
Tariffs are borne by the importer who pay the tariff levy/tax to the government, and the government budget benefits via higher revenue. Higher costs for the importers tend to be passed down to: businesses who use imported products in their own production, manufacturing firms who transform goods into another product and consumers who directly use the goods. Trade disputes usually cause more losers than winners. The uncertainty trade disputes cause hurt business confidence and (and therefore potentially business investment) and producer and consumer prices usually rise. Import-competing businesses in the tariff-levying country could benefit via higher employment and profits if demand shifts to these domestic producers (which some may argue has happened in the US with the US tariffs on China). Tariff-levying countries may experience a rise in their currency which erases some of the gains to the exporters because their products become more expensive on the global market. The US Tax Foundation estimates that the Trump-Biden taxes reduce long-term GDP by ~0.21 percent and wages by 0.14 per cent.
The trade deficit between the US and Chinas has narrowed by ~$10bn since 2018 (see the chart below). However, this has been offset by a deterioration in the trade deficit with the rest of the world which has increased the US trade deficit (the trade deficit has worsened to ~$75bn from ~$40bn in 2018). So, it’s not clear that the 2018 trade tariffs have actually done anything to reduce US import reliance on the world! Ultimately, the US trade deficit reflects that the US saves less than it spends as a nation.
Source: Macrobond, AMP
Trump 2.0 – what to expect
Trump has been campaigning on the premise that he will move to impose a 10% tariff across-the-board and a 60% tariff on imports from China. Under these policies, the US tariff rate would increase to nearly 17% from its current level of ~3%, which is the highest tariff rate since the 1930’s Smoot-Hawley tariff era (see the chart below). It would be expected that other countries would retaliate significantly to these tariffs, and the risk is that this would then turn into a full-blown global trade war. Given the broad range of uncertainties and potential change in spending behaviour if consumers start demanding domestic-produced goods instead of foreign imports, it is hard to be accurate about the impact of tariffs in the long-term. However, estimates from Bloomberg suggest that the tariffs would lift US consumer prices by 2.5% and reduce GDP growth by 0.5% after two years.
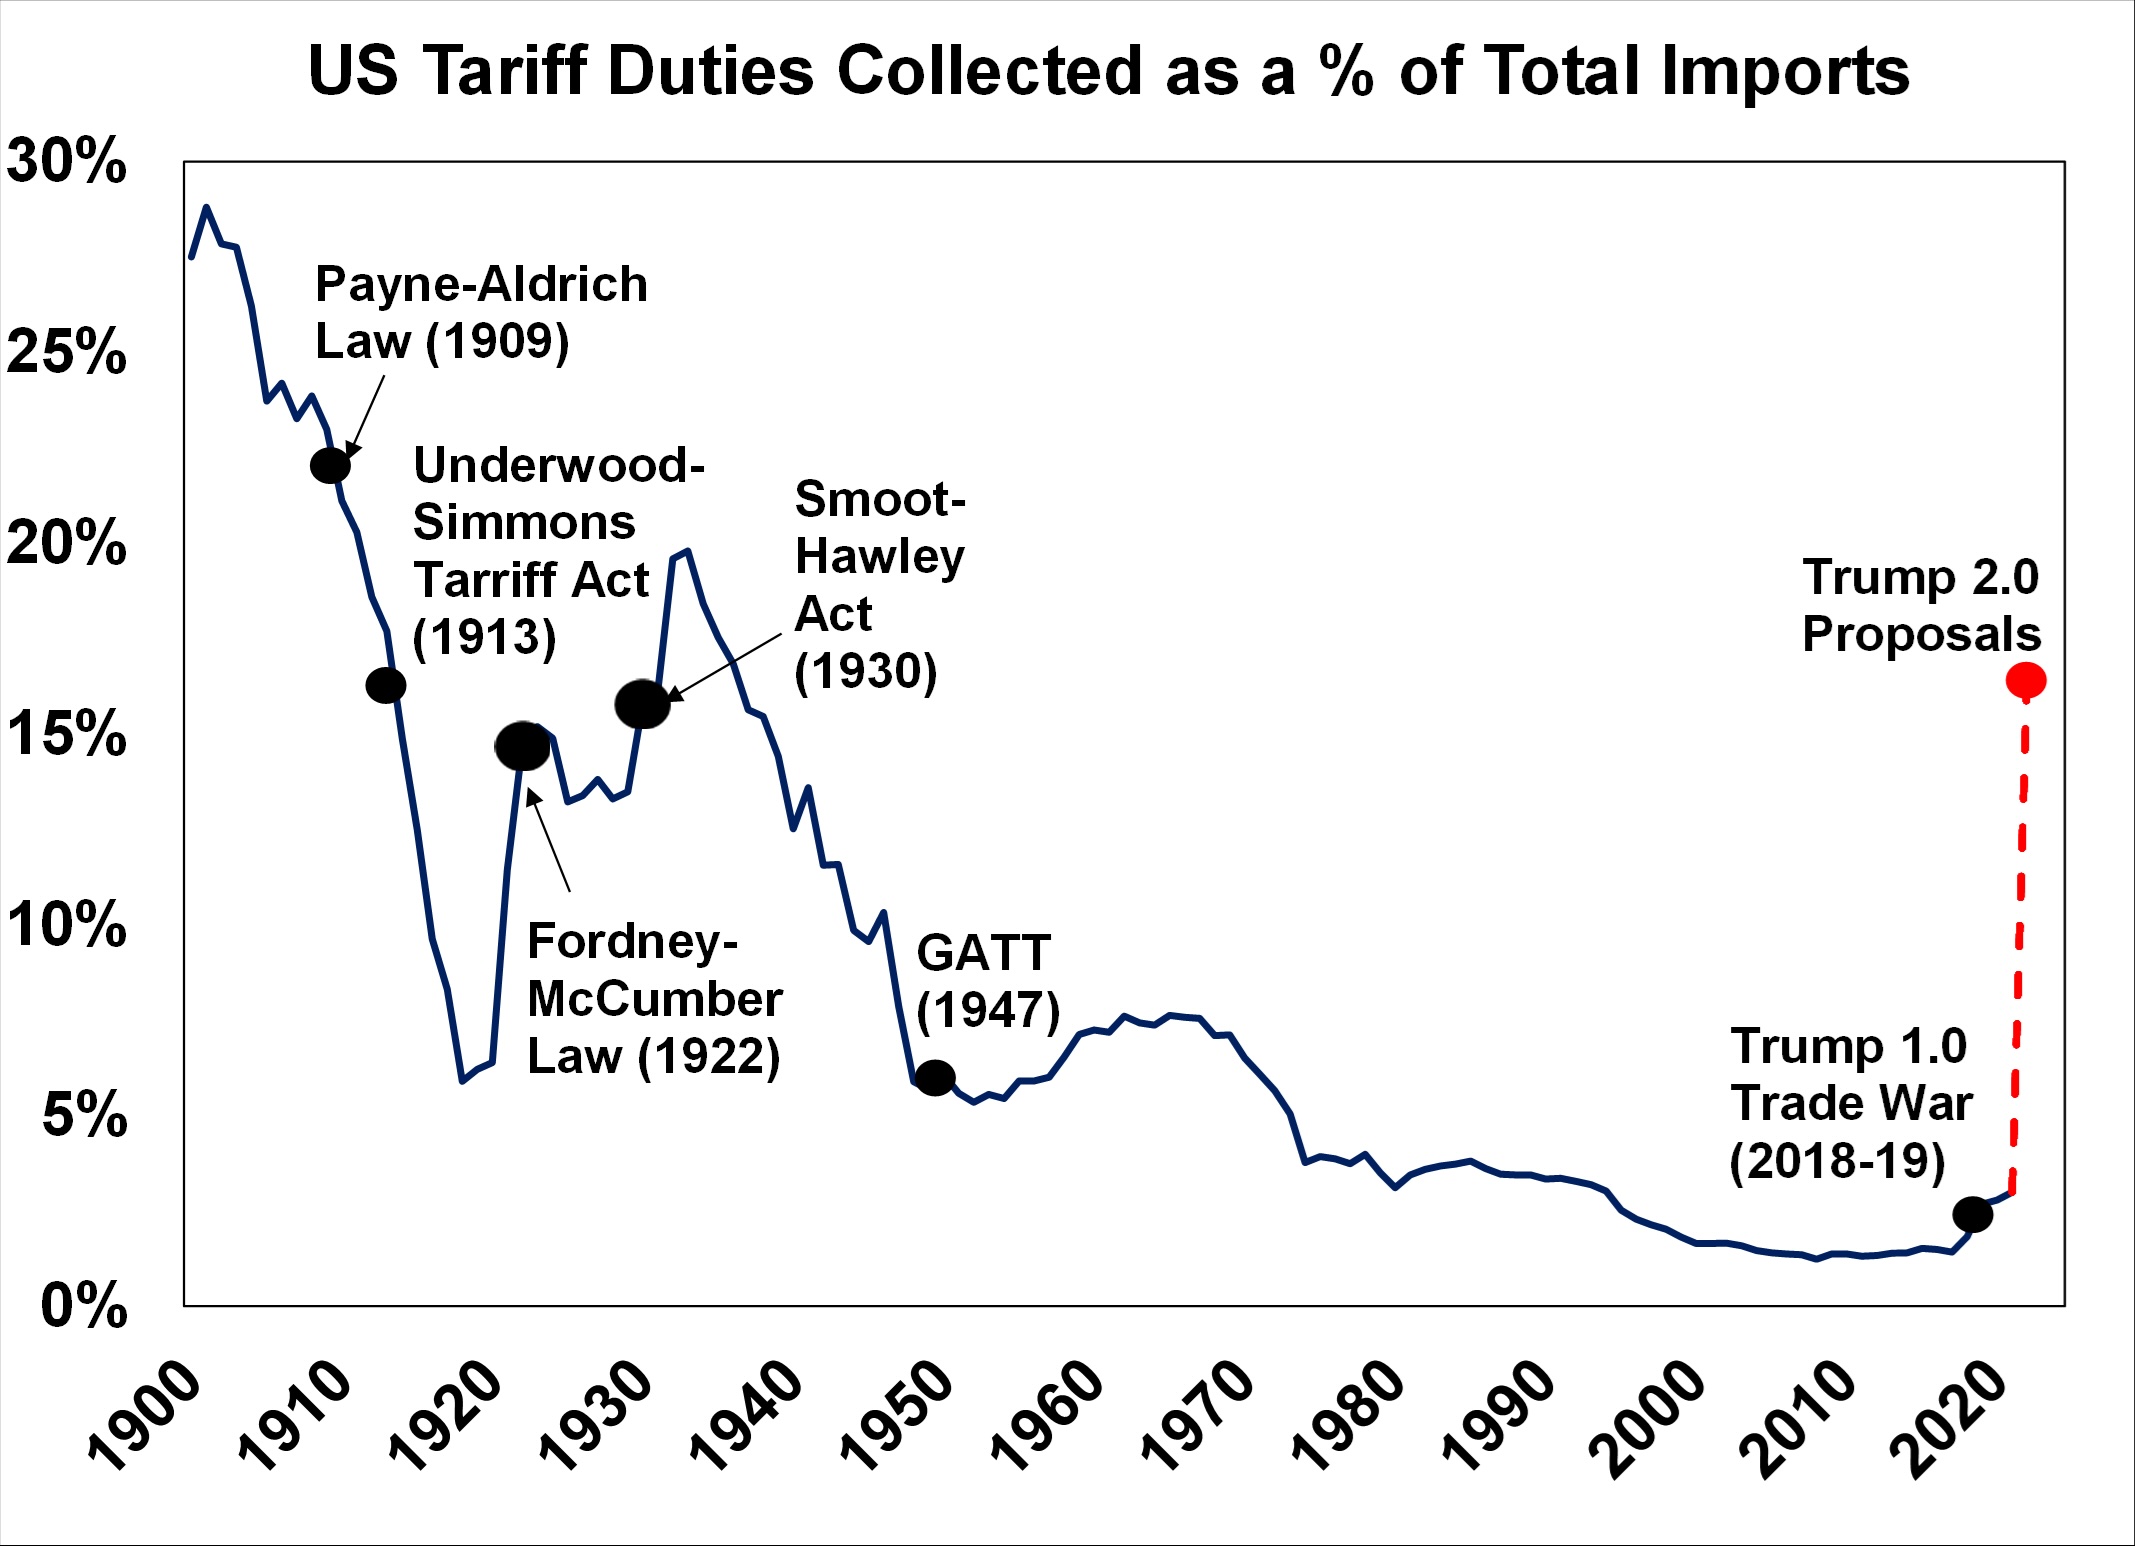
Source: US International Trade Commission, Evercore, AMP
Implications for investors
So far, financial markets have not reacted to the high risk of a trade war if Trump wins the US election in November. There are a few reasons for why this could be the case. Firstly, while the betting markets have Trump ahead of Biden by 9 percentage points (see the chart below) this has bounced around a bit and some may (again) not be taking Trump too seriously, especially after his criminal conviction or assume that he will dial down the trade rhetoric after he is elected (although this certainly didn’t happen in 2016!). Secondly, some may think that Trump is a “known” commodity after his first term and assume that the trade war didn’t cause havoc on global or US growth so any trade war now would be manageable as countries would try to by-pass tariffs through changing production routes. Thirdly, perhaps the market is offsetting potential tariffs with the chance of corporate and personal tax cuts. The Trump 1.0 personal tax cuts are due to expire at the end of 2025. Trump would support extending these (at a cost of $4trillion over 10 years) as well as other proposals like expanding tax credits for children and healthcare and Biden would extend some (for those earnings under $400,000). And recently Trump spoke about reducing the corporate tax rate further to 20% (from 21% at the moment) and expect to pay for these tax cuts through the increase to tariffs. Lastly, perhaps the market is optimistic on the tech theme in markets and assumes that companies like Nvidia can weather trade risks given solid earnings growth forecasts.
Source: Macrobond, Predictlt, AMP
However, in our view the market is underestimating the potential negative impact of an intensified trade war on US and global growth, especially with the close election odds. Even if Trump was to scale back some version of his current proposals, it would still be worse than the 2018 tariffs. Additionally, the market is probably underestimating and under-pricing the long-term potential negative of the broader geopolitical tension between the US and China which will continue as the US is threated by the strategic threat China poses as it expands its technological capabilities and emerges as a key rival in the global tech race.
Australia Launches Plans for Mandatory Climate Reporting, Taxonomy, Sustainable Investment Labels
-
- ESG REPORTING/ GOVERNMENT/ SUSTAINABLE FINANCE
- Mark Segal June 20, 2024
The Government of Australia’s Treasury department announced today the release of its Sustainable Finance Roadmap, outlining its plans to develop and reform financial markets to support the mobilization of private capital needed to finance the transition to a net zero economy, with key priorities including instituting mandatory climate-relating reporting, establishing a sustainable finance taxonomy, and instituting a labeling regime for sustainable investments.
The release of the new roadmap follows the government’s announcement in December 2022 of plans to ““pursue a coordinated and ambitious sustainable finance agenda,” and the subsequent launch by the Treasury in November 2023 of its proposed Sustainable Finance Strategy, outlining the anticipated investments and reforms required to support a sustainable finance sector, with the new roadmap detailing the implementation of the strategy.
The strategy follows a “climate-first, not only” approach to sustainable finance, due to the systemic nature of climate-related opportunities and risks, with plans to expand to other sustainability-related issues and frameworks over time.
The initial focus of the government’s sustainable finance strategy is on the establishment of mandatory disclosure of climate-related financial risks and opportunities. Australia released draft legislation earlier this year which would introduce climate-related reporting requirements for large and medium sized companies, including disclosures on climate-related risks and opportunities, and on greenhouse gas emissions across the value chain.
According to the roadmap, the Australian Accounting Standards Board (AASB) is expected to finalize its climate reporting standards in August 2024, the Australian Auditing and Assurance Board (AUASB) is developing assurance standards for climate disclosures in late 2024, and reporting requirements for the first set of companies to be covered by the new rules will commence on January 1, 2025. The Treasury also aims to develop and publish best practice guidance for the disclosure of corporate transition plans by the end of 2025.
The strategy also includes plans for the development of a Sustainable Finance Taxonomy, providing a set of criteria that can be used to evaluate the alignment or contribution of economic activities to climate and other sustainability objectives. According to the roadmap, the Australian Sustainable Finance Institute (ASFI) will finalize the development of the initial taxonomy by the end of 2024. Aligned with the ‘climate-first’ strategy, the initial taxonomy will cover “green” and “transition” activities that contribute to climate change mitigation, and will focus on six key sectors, including electricity and energy, industry, built environment, transport, resources, agriculture, and land. The government will also explore expanding the taxonomy to cover additional sustainability priorities, according to the roadmap.
Under the sustainable finance strategy, the government has also proposed developing labels for investment products marketed as sustainable, aimed at helping investors understand how sustainability considerations are factored into investment products or strategies, amid a proliferation of “sustainable” investment products. According to the roadmap, Treasury will begin its detailed work on the development of a sustainable investment labelling regime in early 2025, with legislation on the system to be introduced in 2026, and the regime anticipated to take effect in 2027.
The roadmap also outlines steps the government will take to monitor and address greenwashing, expand regulatory capabilities to identify and respond to systemic climate-related financial risks to banks, insurers and superannuation funds, and help address key sustainability data challenges. Additionally, the roadmap covers the government’s issuance of green bonds, noting that its first issuance was early this month, with the offering raising $7 billion.
In a statement announcing the release of the Sustainable Finance Roadmap, Treasurer Jim Chalmers, said:
“This Roadmap will help mobilise the significant private capital required for Australia to become a renewable energy superpower, modernise our financial markets and maximise the economic opportunities associated with net zero and our sustainability goals.
“This is about creating well‑designed and well‑informed financial markets to help companies and investors make investments with confidence, better manage climate and sustainability risks, and help finance the transition to net zero.”
I hope you have enjoyed this weeks read. Please feel free to reach out if you would like any assistance in setting up your investment goals.
Regards,
Head, Fixed Interest and Superannuation
JMP Securities
a. Level 3, ADF Haus, Musgrave St., Port Moresby NCD Papua New Guinea
p. PO Box 2064, Port Moresby NCD Papua New Guinea
Mobile (PNG):+675 72319913
Mobile (Int): +61 414529814