1 March, 2022
Welcome to this week’s JMP Weekly Report
On the equity front I expect it to be very busy on the reporting side. Standby for Market Alerts during the week.
The local bouse saw quite a number of trades pass through the PNGX last week. KSL traded the highest quantity of 161,370 shares closing lower by 0.10 toea or 3.33% to K2.90. CPL also had 126,713 shares changed hands closing unchanged at K0.95. BSP had 58,636 shares trade closing higher by 0.25 toea or 2.08% to K12.25. KAM had 9,610 shares trade unchanged at K1.00 along with CCP also changing hands, trading unchanged at K1.60. Stocks announcing their dividends are BSP, KSL, STO and NCM. Refer below for details;
WEEKLY MARKET REPORT | 21 Febraury, 2022 – 25 February, 2022
| STOCK | QUANTITY | CLOSING PRICE | CHANGE | % CHANGE | 2021 FINAL DIV | 2021 INTERIM | YIELD % | EX-DATE | RECORD DATE | PAYMENT DATE | DRP |
| BSP | 98,636 | 12.25 | 0.25 | 2.08 | k1.3400 | – | 11.61 | THU 10 MAR | FRI 11 MAR | FRI 22 APR | NO |
| KSL | 161,370 | 2.90 | -0.10 | -3.33 | K0.1850 | – | 7.74 | THU 3 MAR | FRI 4 MAR | FRI 8 APR | NO |
| STO | – | 16.55 | – | – | K0.2993 | – | – | MON 21 FEB | TUE 22 FEB | THU 24 MAR | – |
| KAM | 9,610 | 1.00 | – | – | – | – | 10.00 | – | – | – | YES |
| NCM | – | 75.00 | – | – | USD$0.075 | – | – | FRI 25 FEB | MON 28 FEB | MON 28 FEB | – |
| NGP | – | 0.70 | – | – | – | – | – | – | – | – | – |
| CCP | 2,000 | 1.60 | – | – | – | – | 6.19 | – | – | – | YES |
| CPL | 126,713 | 0.95 | – | – | – | – |
– | – | – | – | – |
Dual Listed Stocks
ASX 21.02 – 28.02
BFL – $5 up 0.48
KSL – $.915 up 0.06
NCM – $25.28 up 0.63
STO $7.36 up 0.45
On the interest rate front we have saw the 364 day bills levelling out with the average up 1bpt to 5.17%. BPNG met the oversubscription in the market once again. Finance Company money has dropped from their 5.50% levels with FIFL offering 12mths depo rates around 4.25% which is reflective of what has been happening in the TBill auctions.
No news was released in regard to the next GIS auction, I understand it is still in the approval stages. We will broadcast when we have a firm auction date for you.
What we’ve been reading this week
BSP Financial Group Ltd, Full Year Results 2021
Earlier in the week I sent out an alert regarding the Financial Results for BSP, in case you didn’t see this or haven’t had time to read, below is a summary of the 2021 results
BSP FINANCIAL GROUP LIMITED: FULL YEAR RESULTS 2021
- BSP recorded a statutory net profit of PGK1.075bn in the full financial year 2021, up 33.4% from the corresponding period at the back of good foreign exchange and strong liquidity.
- Statutory earnings per share was up 33.3% to 230.1 toea
- Capital Adequacy ratio was up 250.0 bps to 25.7% meeting the capital adequacy criteria as a ” well capitalised ” bank
- Net profit for the period attributable to shareholders was up 33.4% to PGK1,075.2m
- Net interest income increased by 10.65 driven by higher interest revenues from investment securities
- Revenue from ordinary activities was up by 10.3% to PGK2,372.0m
- Fees and commission increased by 6.1% compared to previous corresponding period
- Foreign exchanged earnings increased by 13.0% driven by higher currency flows from both resource and non-resource based sectors
- Total loans and advances remained largely flat at K14.4bn despite market share increase
- Net loan and investment impairment charge was a credit of K42.6m for 2021, compared to K201.3m expense in 2020.
- The Group operating expenses increased by 10.0% compared to prior year driven by high staff cost needed for growth and AML requirements
- Net Interest Margin was down 10.0bps to 6.4%
- Total deposits grew by 10.5% mainly driven by increases in non-interest bearing account balances.
- 2021 interim dividend, unfranked, of 39 toea, up 14 toea compared to corresponding period. Final dividend, unfranked of 134 toea per share, up 29toea per share. The dividend payment dates as follow;
- Ex-date: 10th -March-2022
- Record date: 11-March-2022
- Payment Date: 22-April-2022
- Full ‘Market Concentration Levy” expected in the first half of 2022 and will have a direct impact of reducing BSP net profit after tax.
The escalation in Ukraine tensions – implications for investors
Dr Shane Oliver, Head of Strategy and Economics and Chief Economist AMP
Key Points
Ukraine tensions have escalated with Russia ordering troops into Ukraine regions already occupied by Russian separatists.
Share markets are at high risk of more downside on fear of further escalation and uncertainty about sanctions/gas supply to Europe.
The history of crisis events shows a short term hit to markets followed by a rebound over 3 to 12 months.
Given the difficulty in timing market reactions to geopolitical developments the best approach for most investors is to stick to an appropriate long term investment strategy.
Introduction
The last few days have seen a sharp escalation in the situation between Russia and Ukraine, with Russia recognising the independence of two regions in the Donbas area of eastern Ukraine that have been controlled by Russian separatists since 2014 and ordering Russian “peacekeeping” troops into the regions. At this stage it’s unclear how big the force will be, whether it will push beyond the areas controlled by the separatists and, if so, how far. Although President Putin continues to deny plans to invade Ukraine, his comments suggest a move into the areas of Donetsk and Luhansk in the Donbas that the rebels do not yet control.
As a result share markets have fallen further, with US and global shares falling just below their January lows and Australian shares under pressure too, albeit so far they have held up a bit better. Bond yields have also fallen due to safe haven demand and oil prices have pushed to new post 2014 highs. The market reaction reflects a combination of uncertainty around how far the conflict will go – with Ukraine being Europe’s second biggest country (after Russia), the threat of further sanctions (so far they have been limited) and uncertainty about how severe their economic impact will be. Although it has said it won’t, there is also the risk Russia cuts off its supply of gas to Europe where prices are already very high, with a potential flow on to oil demand at a time when conflict may threaten supply. In short, investors are worried about a stagflationary shock to Europe and, to a lesser degree, the global economy generally.
Possible scenarios
Trying to work out which way this goes is not easy and I am not a geopolitical expert. But it still seems there are four scenarios, some of which may overlap:
- Russia stands down – this would provide a brief boost for share markets, including Australian shares, (eg +2 to +4%) as markets reverse recent falls that were driven by escalating tensions.
- Russia moves in to occupy the Donbas areas that are already controlled by Russian separatists with sanctions from the west but not so onerous that Russia cuts of gas to Europe – this could see a further hit to markets (say -2%), although it looks like it may be getting close to priced in. This may be similar to what happened in the 2014 Ukraine crisis (with Crimea) and if that’s all that happens then markets would soon forget about it and move on to other things. Much as occurred in 2014.
- Russian invasion of all of Ukraine with significant sanctions and Russia stopping gas to Europe but no NATO military involvement – this would cause a stagflationary shock to Europe & to a less degree globally as oil prices rise further and could see a bigger hit to markets (say -10%) but then recovery over six months.
- Invasion of all of Ukraine with significant sanctions, gas supplies cut & NATO military involvement – this could be a large negative for markets (say -15-20%) as war in Europe, albeit on its edge, fully reverses the “peace dividend” that flowed from the end of the cold war in the 1990s. Markets may then take longer to recover, say 6-12 months.
Given the path Russia has gone down and the stridency of President Putin’s recent comments, Scenario 1 is looking less and less likely, but is still possible if there is a breakthrough in talks. And Scenario 2 looks to be already on the way, with Putin’s ordering of “peacekeeping” troops into the Donbas region. This may be the “military-technical” action that Russia referred to last week. At the other extreme, it’s still hard to see Russia undertaking a full invasion of Ukraine given the huge cost it would incur. And it’s hard to see NATO troops being involved particularly given limited public support for it in Europe and the US. The US has said US forces would not go into Ukraine. However, some combination of scenarios 2 and 3 are possible whereby the crisis escalates further if, say, the Donbas separatists and the Russian “peacekeepers” push into Donbas territory that the separatists do not yet control and beyond.
And, of course, with Russian troops moving into the Donbas region of Ukraine investment markets will worry that we will move on to a wider invasion of Ukraine, until signs appear to the contrary. So, we could still see share markets fall further and oil prices rise further in the short term.
Crisis and share markets
Of course, there is a long history of various crisis events impacting share markets. This includes major events in wars, terrorist attacks, financial crisis, etc. The following table shows major crisis events since World War Two in the first column, the period over which the US share market initially reacts in the second column, the percentage share market fall in the third column and the percentage change from the low over 3, 6 and 12 months in the final three columns.
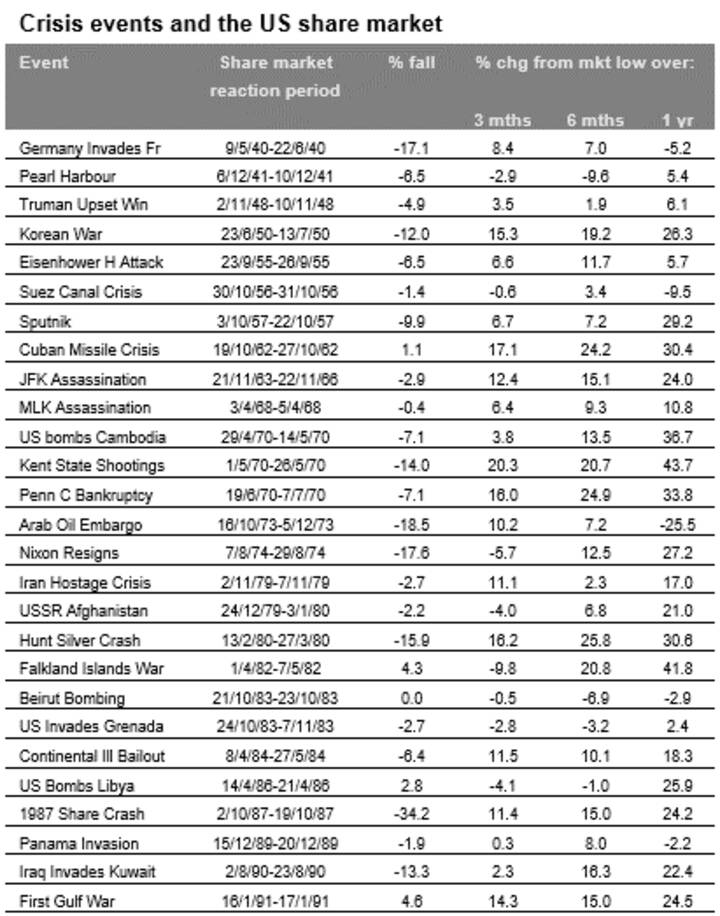
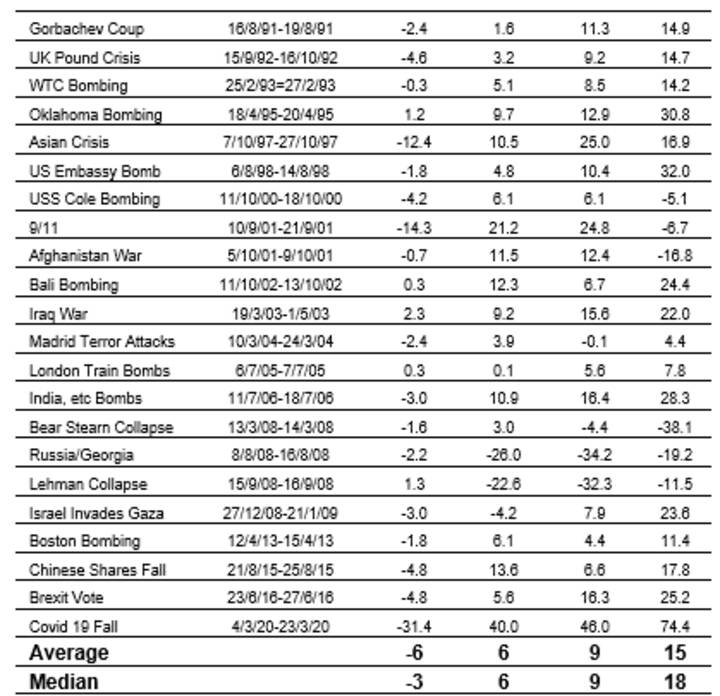
Based on the Dow Jones Index. Intended as a guide only as other developments also impact shares around the dates shown. Source: Ned Davis Research
The pattern is pretty much the same for most events, with an initial sharp fall in the share market followed by a rebound. Since World War Two the average decline has been 6%, but six months later the share market is up 9% on average and 1 year later its up around 15%.
What does it all mean for investors?
I don’t have a perfect crystal ball and its even hazier when it comes to events around wars. But from the point of sensible long-term investing, the following points are always worth bearing in mind in times of investment markets uncertainty like the present:
- Periodic sharp falls in share markets are healthy and normal, but with the long-term rising trend ultimately resuming and shares providing higher long term returns than other more stable assets.
- Selling shares or switching to a more conservative investment strategy after a major fall just locks in a loss and trying to time the rebound is very hard such that many only get back in after the market has recovered.
- When shares fall, they are cheaper and offer higher long-term return prospects. So, the key is to look for opportunities the pullback provides. It’s impossible to time the bottom but one way to do it is to average in over time.
- While shares have fallen, dividends from the market haven’t. Companies like to smooth their dividends over time – they never go up as much as earnings in the good times and so rarely fall as much in the bad times. And in the meantime, the income the dividends provide is still being received.
- Shares and other related assets bottom at the point of maximum bearishness, ie, just when you feel most negative towards them.
- The best way to stick to an appropriate long-term investment strategy, let alone see the opportunities that are thrown up in rough times, is to turn down the noise around the news and opinion flow that is now bombarding us.
Four Reasons to expect a softer US Economy in 2022
Diana Mousina,
Economist, Investment Strategy and Dynamic Markets
Key points
The US economy is facing numerous headwinds in 2022 which will slow US economic growth.
Inflation is too high, interest rates are going to rise, the value of the Fed’s balance sheet will fall and fiscal “thrust” has turned negative. These factors are also leading to a peak in earnings growth.
We expect lower equity returns in the US market in 2022 compared to recent years. Non-US shares can outperform in an environment of rising global bond yields.
Introduction
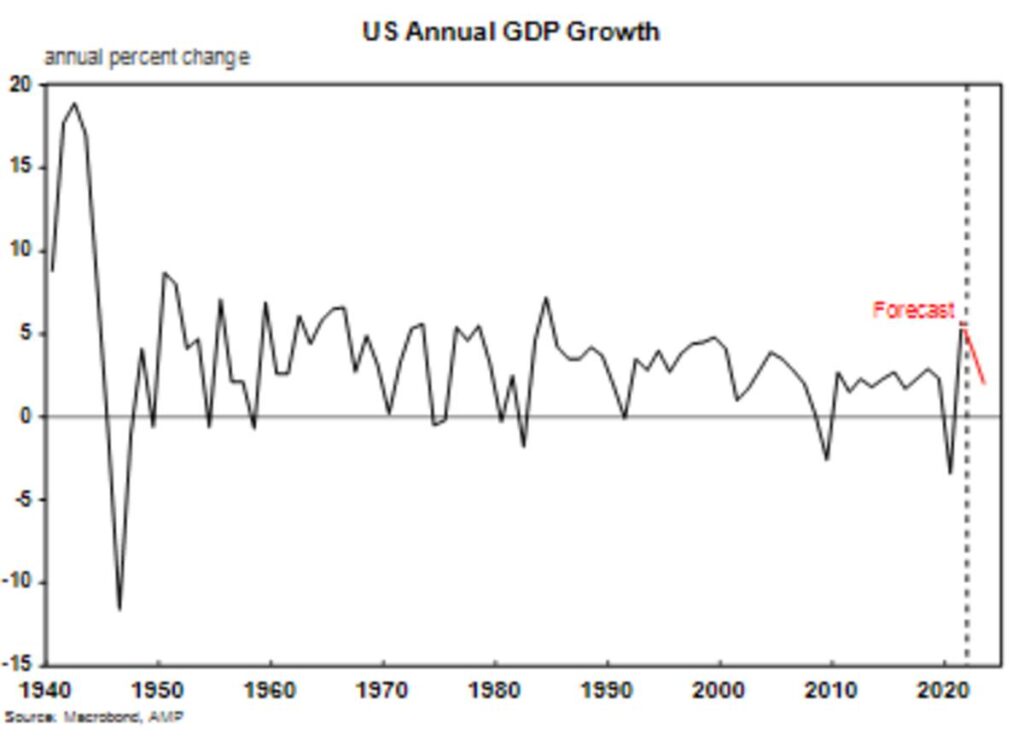
The Covid-19 disruption led to a 3.4% decline in US GDP over 2020. This was the largest annual fall since an 11.6% collapse at the end of WWII in 1946. Like many other countries, growth rebounded strongly in 2021, up by 5.7% in 2021, more than offsetting the Covid-induced decline.
2022 will be another year of recovery from the pandemic as services spending normalises. But, the tailwinds of growth that drove the strong US economic recovery over late 2020/21 are starting to fade. US GDP growth is set to slow down in coming years. We expect GDP growth of just over 4% in 2022, followed by 2% in 2023. In this Econosights we go through the four reasons for why we are expecting a slowdown in the US economy.
1/ Inflation is too high
Before the pandemic started, the US had spent a large part of the prior decade with consumer price inflation undershooting the Fed’s 2% target. Covid-19 led to a massive loosening of fiscal policy, more monetary stimulus, huge demand for consumer goods (both durable and non-durable) and disruptions in the global supply chain (the unanticipated surge in goods demand alongside temporary factory closures and changes in transport of goods). As a result, inflation has surged on all measures. Core consumer price inflation is at 6% while the core personal consumption expenditure index is at 4.9%, both at multi-decade highs. While wages have responded with average hourly earnings are up 5.7% over the year to January, continuous high inflation will be negative for economic activity because it eats into the spending power for businesses and consumers. One potential offset for consumers from high inflation is the large build-up in excess savings since the start of the pandemic which is worth $2.4tn or ~10% of annual GDP.
High inflation means that the US Fed will need to raise rates relatively swiftly in 2022.
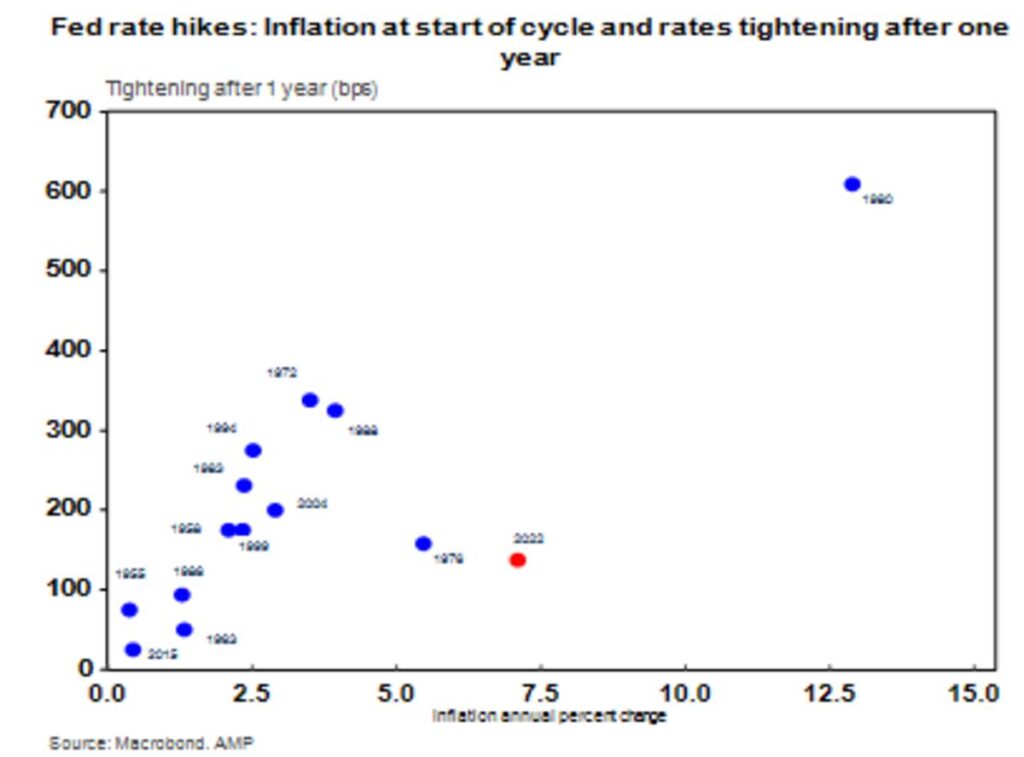
2/ Interest rates set to rise quickly in 2022
In response to the inflation outbreak, the Fed will need to raise the fed funds rate faster than anticipated just a few months ago. The market is pricing in six or seven 25 basis point interest rate rises over the next 12 months. This is an aggressive rate hike profile (compared to the recent years of low interest rates) and it assumes a rate rise at nearly every meeting in 2022. We think the current market pricing looks fair year which means that the fed funds raise is likely be be around 1.7% in a year from now (from the current level of 0-0.25%), around 150 basis points worth of hikes. While this seems steep, it isn’t compared to prior interest rate hike cycles, given the current level of inflation. The chart below demonstrates this well, showing that at inflation levels well below the current headline figures, the Fed has lifted interest rates by 200-300 basis points in one year. So, the risk is that the Fed is behind the curve in tackling the high level of inflation (compared to historical rate hike cycles) and will need to do more hikes if inflation proves sticky.
Interest rate hikes will lift mortgage rates, with the US 30-year mortgage rate already up at 3.4% (from 2% a year ago), its highest level since mid-2019. And financial conditions are tightening.
In this rate hike cycle, the fed funds rate can probably get to a peak of 2.5%, our estimate of the US “neutral” interest rate.
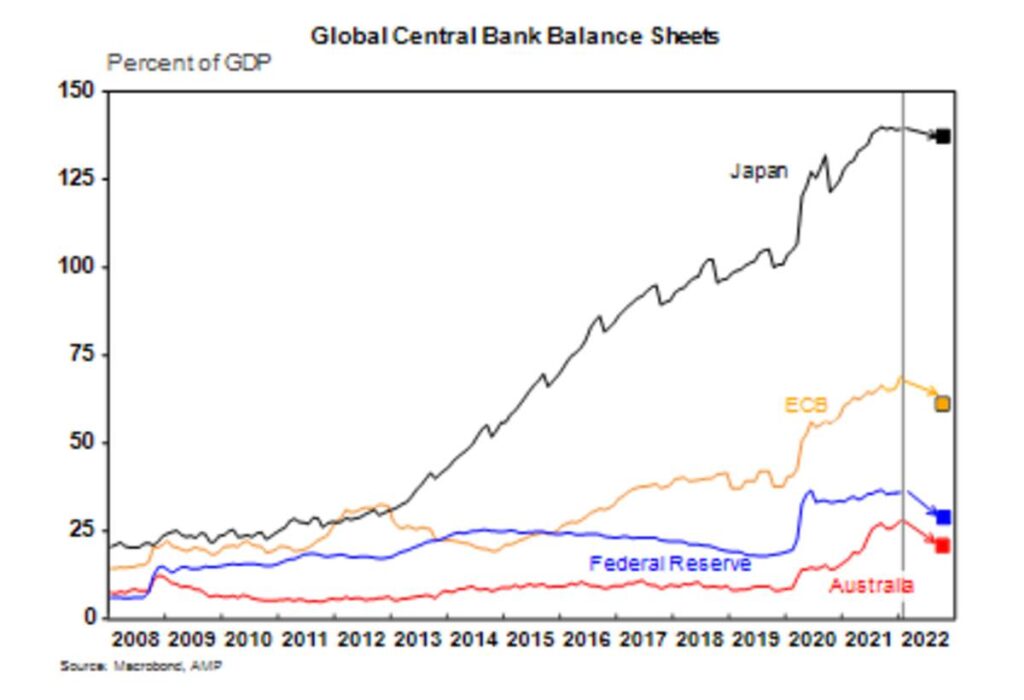
3/ The Fed will reduce the size of its balance sheet
The value of the Fed’s balance sheet has more than doubled since the start of the pandemic, currently standing at 36% of GDP. This is probably the peak in the Fed’s balance sheet, with quantitative tightening (QT) expected to start around mid-year. QT will be done through allowing assets (bonds and mortgage-backed securities) to roll-off the Fed’s balance sheet and not re-investing the proceeds and/or actively selling assets before they mature. Quantitative tightening is likely to place further upwards pressure on bond yields and be negative for asset prices. The Fed has reduced the size of its balance sheet before, but the upcoming QT process will occur at a faster rate compared to history so there are still some risks to the process. However, the Fed can readily increase its balance sheet again if it needs to, once it starts the QT process. So it’s unlikely that QT, on its own, will cause a big upwards shift in yields or a bear market in equities. We expect the Fed’s balance sheet to decline to around 30% of GDP in a year’s time.
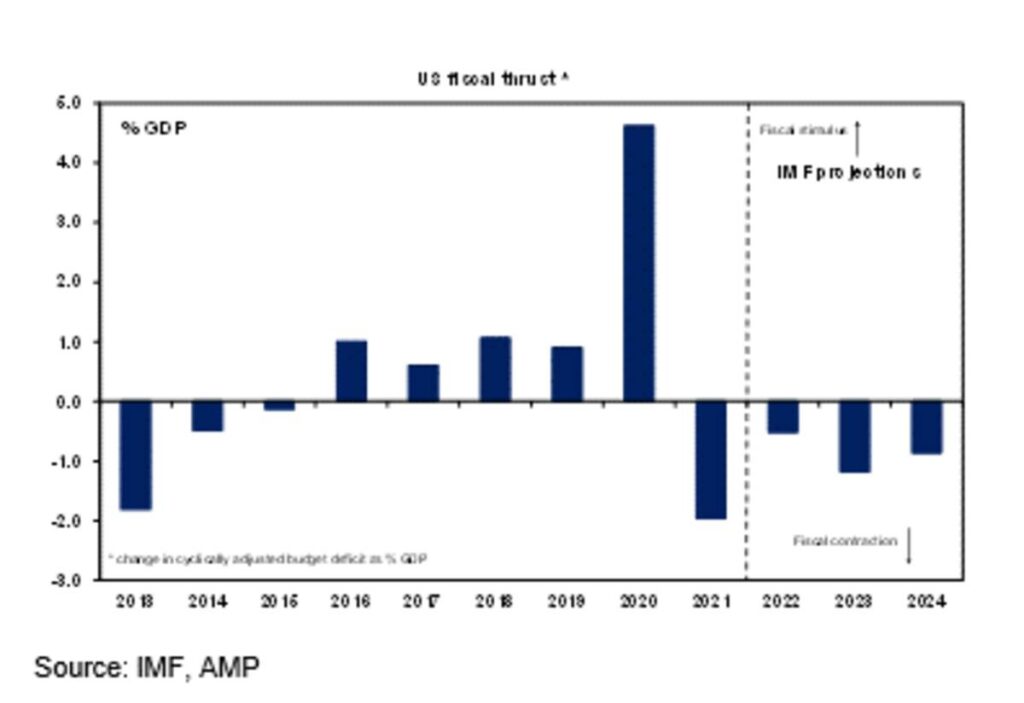
4/ Fiscal policy is tightening
Fiscal policy is tightening or becoming less stimulatory after the pandemic spending binge. “Fiscal thrust” is a measure of the change in the budget as a share of GDP to gauge the degree of tightness in fiscal policy. The US is currently running a budget deficit. So, as fiscal policy loosens (or becomes stimulatory), the budget deficit rises and fiscal thrust rises (see the chart below). As the budget deficit has been narrowing over 2021 (and will continue to narrow into 2022) since its explosion in 2020, fiscal thrust has been turning negative. This already occurred in 2021 and will continue in 2022, despite the potential passage of Build Back Better (and if it does get passed it will be a much smaller package, or potentially a few small packages).
One positive is that the worst of the fiscal drag may have already occurred in 2021. In the past year, the budget deficit has already narrowed by $2.4tn – 10% of GDP.
The midterms in November are likely to result in the Democrats losing their majority in the House of Representatives and also potentially in the Senate, so any major policies that increase the deficit are unlikely to be agreed on after November.
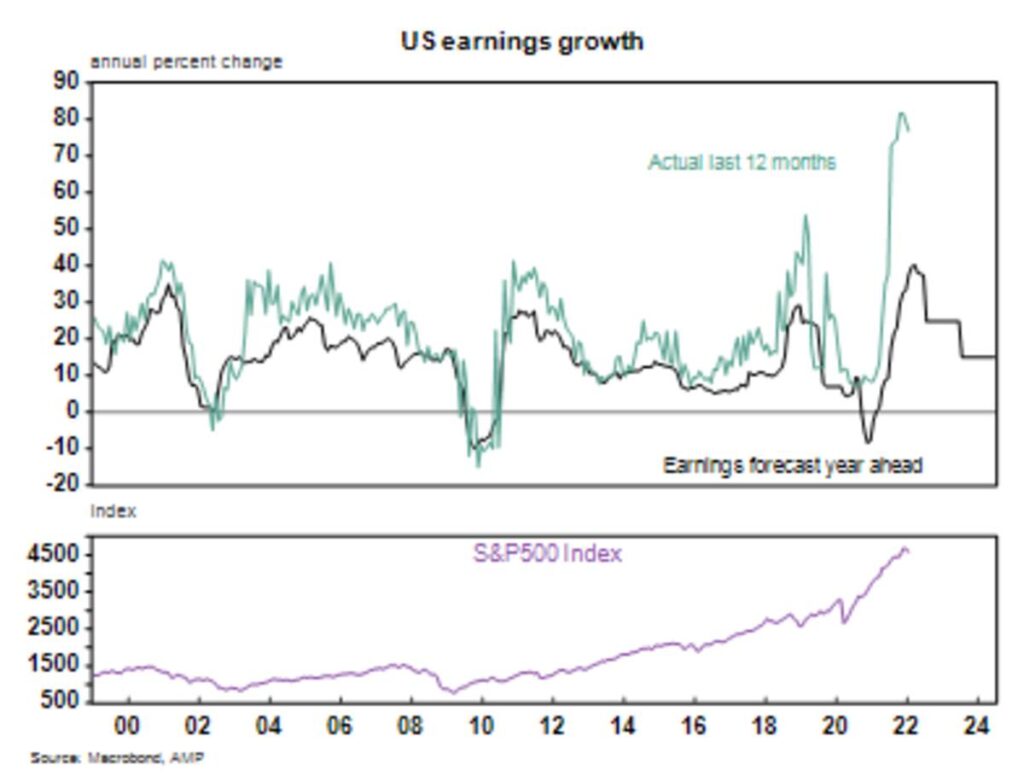
Earnings growth has peaked
These 4 factors that will slow US economic growth in 2022 will also weigh on earnings. Exceptionally strong US earnings growth in 2021 (see the chart below) reflects the rebound in the economy from stimulus measures and the huge run-up in technology/large consumer discretionary profits, which massively benefited from the pandemic (lower bond yields, shift to working from home and lift in consumer goods demand). While earnings growth is expected to be positive over the next year (we expect ~10-15%), the pace of growth is slowing as interest rate hikes and higher bond yields threaten long-term profits from large technology companies.
But, while earnings growth remains positive it is hard to become too bearish on US shares. Risks for a serious bear market would result from negative profit growth, but we are not there yet.
Conclusion
US economic and profit growth is set to slow in 2022. The main downside risk to growth is a central bank tightening into a slowing economy. While the Fed needs to bring inflation down, it should still tread carefully in raising interest rates. But it’s hard to get too pessimistic on the US economy. There are still plenty of positives. Large pent-up consumer savings provide an offset to high inflation and interest rate rises, a strong labour market will keep the unemployment rate low and wages growth elevated, services spending will rise further in 2022 as it is now just getting back to its pre-Covid levels and business investment is rising, which is also positive for future productivity growth. Recession risks are low for now. We think the risk of a major growth slowdown or a recession is more of a risk from 2024 as interest rates rise further.
Slowing profit growth alongside slower economic growth and the rise in interest rate rates means we expect lower equity returns in the US market in 2022 compared to recent years. We think non-US shares can outperform in an environment of rising global bond yields which will weigh on tech stocks (which the US share market has a high exposure to compared to other global share markets).
Green hydrogen now cheaper than blue in Middle East, but still way more expensive in Europe

The 300MW Sakaka solar farm in Saudi Arabia.Photo: ACWA Power
Renewable H2 would cost less to produce across the Gulf states, based on today’s gas and power prices, but such a price difference seems unlikely in European nations until the 2030s, according to separate analyst figures
Green hydrogen would be cheaper to produce today than blue H2 across the sunny, oil-rich Middle East, according to figures from analyst S&P Global Platts.
A separate assessment by UK-based Aurora Energy Research states that blue hydrogen — derived from natural gas using steam methane reformation with carbon capture and storage (CCS) — will probably be cheaper to produce in Europe than renewable H2 until the 2030s.
At current renewable electricity and gas prices, green hydrogen would be cheaper to produce than blue in Saudi Arabia, the United Arab Emirates (UAE), Qatar and Oman, according to Platts.
The cheapest location for renewable H2 would be Qatar ($2.62/kg), followed by Saudi Arabia ($3.23/kg), Oman ($3.58/kg) and UAE ($4.51/kg) when using alkaline electrolysers, with prices for PEM electrolysers roughly $1/kg higher.
By contrast, blue H2 would cost between $4.66-$4.80/kg in those nations.
A similar situation exists in Western Australia, with green hydrogen costing $2.61/kg, compared to $4.65/kg for blue.
I hope you have enjoyed this week’s read, have an awesome week.
Regards
Chris Hagan,
Head, Fixed Interest and Superannuation
JMP Securities
Level 1, Harbourside West, Stanley Esplanade
Port Moresby, Papua New Guinea
Mobile (PNG):+675 72319913
Mobile (Int): +61 414529814